| Param | Original file | Final file |
|---|---|---|
| Filename | modeM0/AS1G05_112T01_9000000452cztM0_level2.evt | modeM0/AS1G05_112T01_9000000452cztM0_level2_quad_clean.evt |
| Size (bytes) | 12,379,049,280 | 2,276,046,720 |
| Size | 11.5 GB | 2.1 GB |
| Events in quadrant A | 86,550,563 | 14,237,791 |
| Events in quadrant B | 99,741,723 | 14,332,923 |
| Events in quadrant C | 90,737,847 | 14,200,125 |
| Events in quadrant D | 85,516,325 | 13,625,425 |
| Mode M0 | |||
|---|---|---|---|
| Quadrant | BADHDUFLAG | Total packets | Discarded packets |
| A | 0 | 384616 | 0 |
| B | 0 | 417303 | 0 |
| C | 0 | 396735 | 0 |
| D | 0 | 389923 | 0 |
| Mode SS | |||
|---|---|---|---|
| Quadrant | BADHDUFLAG | Total packets | Discarded packets |
| A | 0 | 3724 | 0 |
| B | 0 | 3724 | 0 |
| C | 0 | 3724 | 0 |
| D | 0 | 3724 | 0 |
| Mode M9 | |||
|---|---|---|---|
| Quadrant | BADHDUFLAG | Total packets | Discarded packets |
| A | 0 | 303 | 0 |
| B | 0 | 302 | 0 |
| C | 0 | 302 | 0 |
| D | 0 | 302 | 0 |
| Quadrant | Total seconds | Saturated seconds | Saturation percentage |
|---|---|---|---|
| A | 183130 | 2856 | 1.559548% |
| B | 183130 | 3719 | 2.030798% |
| C | 183129 | 2501 | 1.365704% |
| D | 183128 | 3008 | 1.642567% |
Noise dominated data is calculated using 1-second bins in cleaned event files. If a bin has >2000 counts, and if more than 50% of those come from <1% of pixels, then it is considered to be noise-dominated and hence unusable.
| Quadrant | # 1 sec bins | Bins with >0 counts | Bins with >2000 counts | High rate bins dominated by noise | Noise dominated (total time) | Noise dominated (detector-on time) | Marked lightcurve |
|---|---|---|---|---|---|---|---|
| A | 255007 | 183170 | 232 | 232 | 0.09% | 0.13% |  |
| B | 255007 | 183170 | 503 | 503 | 0.20% | 0.27% |  |
| C | 255007 | 183170 | 593 | 593 | 0.23% | 0.32% |  |
| D | 255007 | 183168 | 1037 | 1037 | 0.41% | 0.57% |  |
Top three noisy pixels from each quadrant. If the there are fewer than three noisy pixels in the level2.evt file, extra rows are filled as -1
| Pixel properties | Quadrant properties | ||||||
|---|---|---|---|---|---|---|---|
| Quadrant | DetID | PixID | Counts | Sigma | Mean | Median | Sigma |
| A | 0 | 118 | 1133796 | 255.68 | 21426 | 20954 | 4352.6 |
| A | 14 | 249 | 796339 | 178.14 | 21426 | 20954 | 4352.6 |
| A | 0 | 31 | 721065 | 160.85 | 21426 | 20954 | 4352.6 |
| B | 15 | 204 | 7352631 | 1764.78 | 21706 | 21207 | 4154.3 |
| B | 14 | 167 | 2415817 | 576.42 | 21706 | 21207 | 4154.3 |
| B | 4 | 170 | 2313393 | 551.76 | 21706 | 21207 | 4154.3 |
| C | 1 | 192 | 3152361 | 643.13 | 20965 | 21106 | 4868.8 |
| C | 9 | 144 | 2223322 | 452.31 | 20965 | 21106 | 4868.8 |
| C | 14 | 223 | 1128716 | 227.49 | 20965 | 21106 | 4868.8 |
| D | 13 | 223 | 3745572 | 742.87 | 20826 | 20236 | 5014.8 |
| D | 12 | 79 | 561449 | 107.92 | 20826 | 20236 | 5014.8 |
| D | 5 | 233 | 510132 | 97.69 | 20826 | 20236 | 5014.8 |
Histogram calculated using DETX and DETY for each event in the final _common_clean file
| Quadrant A |  |
 |
Quadrant B |
|---|---|---|---|
| Quadrant D |  |
 |
Quadrant C |
| Plot type | Count rate plots | Images |
|---|---|---|
| Comparison with Poisson distribution Blue bars denote a histogram of data divided into 1 sec bins. Red curve is a Poisson curve with rate = median count rate of data. |
 |
 |
| Quadrant-wise count rates Data is divided into 100 sec bins |
 |
|
| Module-wise count rates for Quadrant A Data is divided into 100 sec bins |
 |
 |
| Module-wise count rates for Quadrant B Data is divided into 100 sec bins |
 |
 |
| Module-wise count rates for Quadrant C Data is divided into 100 sec bins |
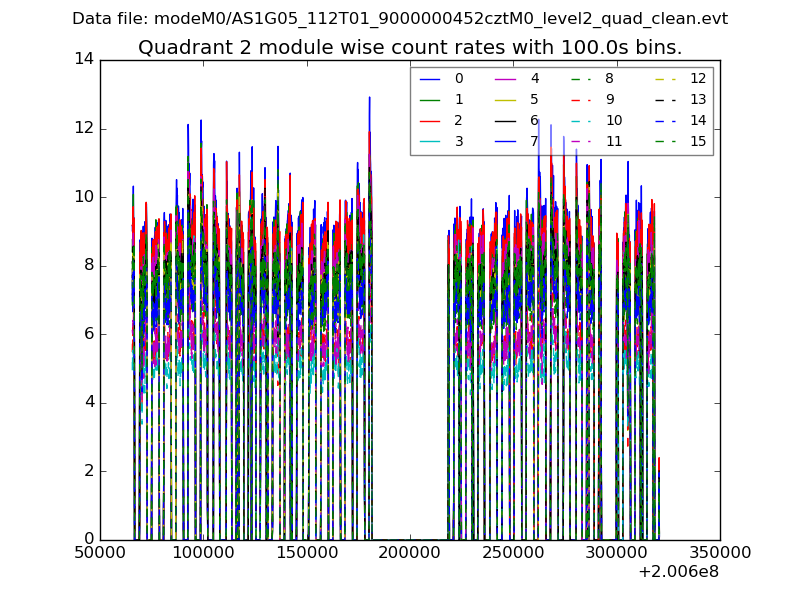 |
 |
| Module-wise count rates for Quadrant D Data is divided into 100 sec bins |
 |
 |
| Parameter | Plot |
|---|---|
| CZT HV Monitor |  |
| D_VDD |  |
| Temperature 1 |  |
| Veto HV Monitor |  |
| Veto LLD |  |
| Alpha Counter |  |
| _CPM_Rate | 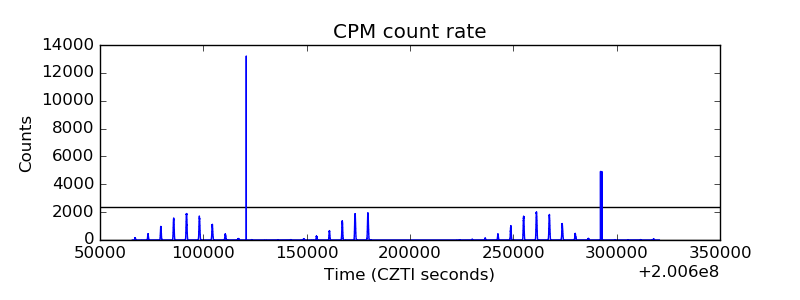 |
| CZT Counter |  |
| +2.5 Volts monitor |  |
| +5 Volts monitor | 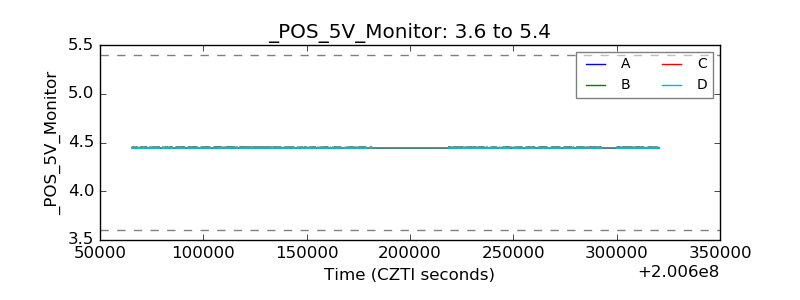 |
| _ROLL_ROT |  |
| _Roll_DEC |  |
| _Roll_RA |  |
| Veto Counter |  |