| Param | Original file | Final file |
|---|---|---|
| Filename | modeM0/AS1G05_246T01_9000000450cztM0_level2.evt | modeM0/AS1G05_246T01_9000000450cztM0_level2_quad_clean.evt |
| Size (bytes) | 10,581,336,000 | 1,786,950,720 |
| Size | 9.9 GB | 1.7 GB |
| Events in quadrant A | 67,548,273 | 11,018,557 |
| Events in quadrant B | 84,423,439 | 11,271,957 |
| Events in quadrant C | 84,918,509 | 11,043,940 |
| Events in quadrant D | 73,577,686 | 10,638,789 |
| Mode M9 | |||
|---|---|---|---|
| Quadrant | BADHDUFLAG | Total packets | Discarded packets |
| A | 0 | 206 | 0 |
| B | 0 | 209 | 0 |
| C | 0 | 209 | 0 |
| D | 0 | 208 | 0 |
| Mode M0 | |||
|---|---|---|---|
| Quadrant | BADHDUFLAG | Total packets | Discarded packets |
| A | 0 | 306215 | 0 |
| B | 0 | 347758 | 0 |
| C | 0 | 355190 | 0 |
| D | 0 | 328310 | 0 |
| Mode SS | |||
|---|---|---|---|
| Quadrant | BADHDUFLAG | Total packets | Discarded packets |
| A | 0 | 3009 | 0 |
| B | 0 | 3020 | 0 |
| C | 0 | 3016 | 0 |
| D | 0 | 3008 | 0 |
| Quadrant | Total seconds | Saturated seconds | Saturation percentage |
|---|---|---|---|
| A | 148187 | 2341 | 1.579761% |
| B | 148119 | 3137 | 2.117892% |
| C | 148145 | 3856 | 2.602855% |
| D | 148156 | 3023 | 2.040417% |
Noise dominated data is calculated using 1-second bins in cleaned event files. If a bin has >2000 counts, and if more than 50% of those come from <1% of pixels, then it is considered to be noise-dominated and hence unusable.
| Quadrant | # 1 sec bins | Bins with >0 counts | Bins with >2000 counts | High rate bins dominated by noise | Noise dominated (total time) | Noise dominated (detector-on time) | Marked lightcurve |
|---|---|---|---|---|---|---|---|
| A | 173522 | 148450 | 56 | 56 | 0.03% | 0.04% |  |
| B | 173522 | 148390 | 439 | 439 | 0.25% | 0.30% |  |
| C | 173522 | 148419 | 1791 | 1791 | 1.03% | 1.21% |  |
| D | 173522 | 148426 | 1117 | 1117 | 0.64% | 0.75% |  |
Top three noisy pixels from each quadrant. If the there are fewer than three noisy pixels in the level2.evt file, extra rows are filled as -1
| Pixel properties | Quadrant properties | ||||||
|---|---|---|---|---|---|---|---|
| Quadrant | DetID | PixID | Counts | Sigma | Mean | Median | Sigma |
| A | 0 | 50 | 353684 | 95.64 | 17241 | 16850 | 3521.8 |
| A | 0 | 118 | 300299 | 80.48 | 17241 | 16850 | 3521.8 |
| A | 0 | 226 | 205390 | 53.54 | 17241 | 16850 | 3521.8 |
| B | 15 | 204 | 10074874 | 2983.82 | 17497 | 17079 | 3370.8 |
| B | 14 | 167 | 2205839 | 649.33 | 17497 | 17079 | 3370.8 |
| B | 3 | 0 | 1380968 | 404.62 | 17497 | 17079 | 3370.8 |
| C | 8 | 208 | 8313381 | 2121.62 | 16799 | 16893 | 3910.5 |
| C | 14 | 223 | 6304603 | 1607.92 | 16799 | 16893 | 3910.5 |
| C | 1 | 192 | 1403636 | 354.62 | 16799 | 16893 | 3910.5 |
| D | 13 | 223 | 4468997 | 1096.43 | 16782 | 16300 | 4061.1 |
| D | 12 | 246 | 2633122 | 644.37 | 16782 | 16300 | 4061.1 |
| D | 13 | 239 | 721704 | 173.7 | 16782 | 16300 | 4061.1 |
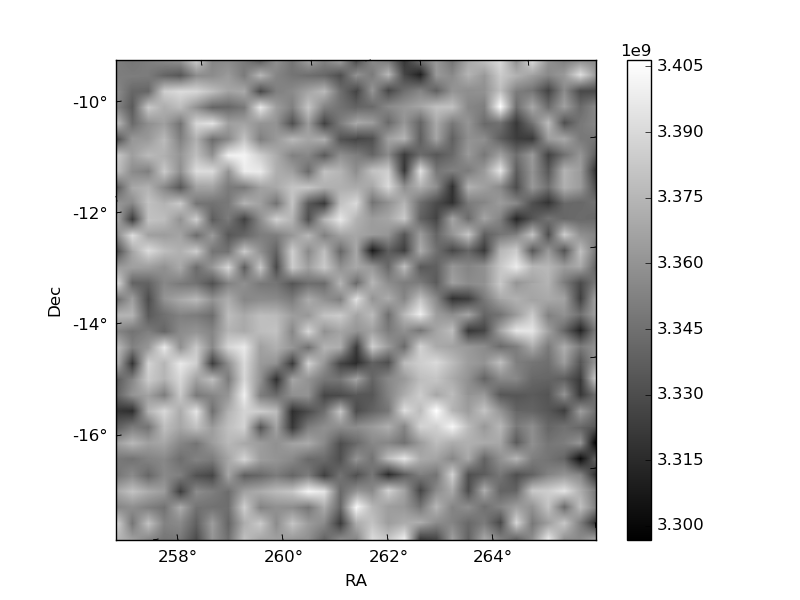
Histogram calculated using DETX and DETY for each event in the final _common_clean file
| Quadrant A | 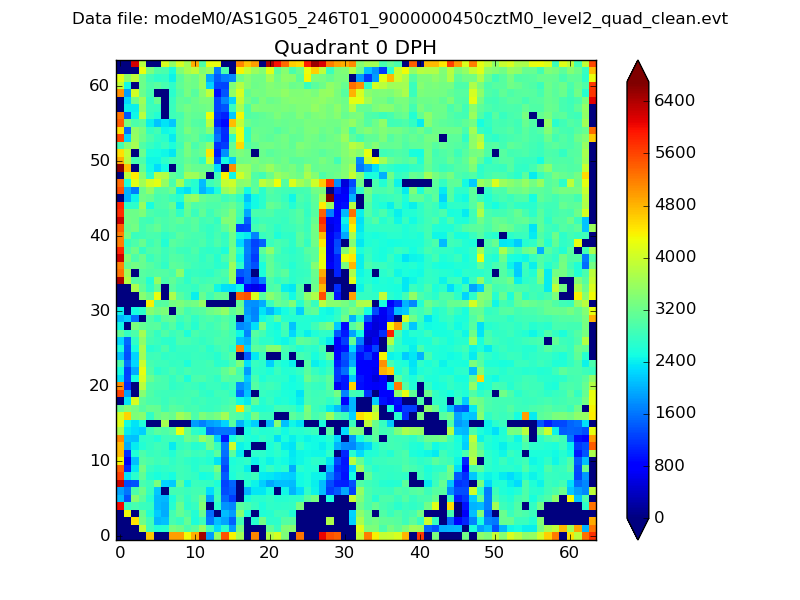 |
 |
Quadrant B |
|---|---|---|---|
| Quadrant D |  |
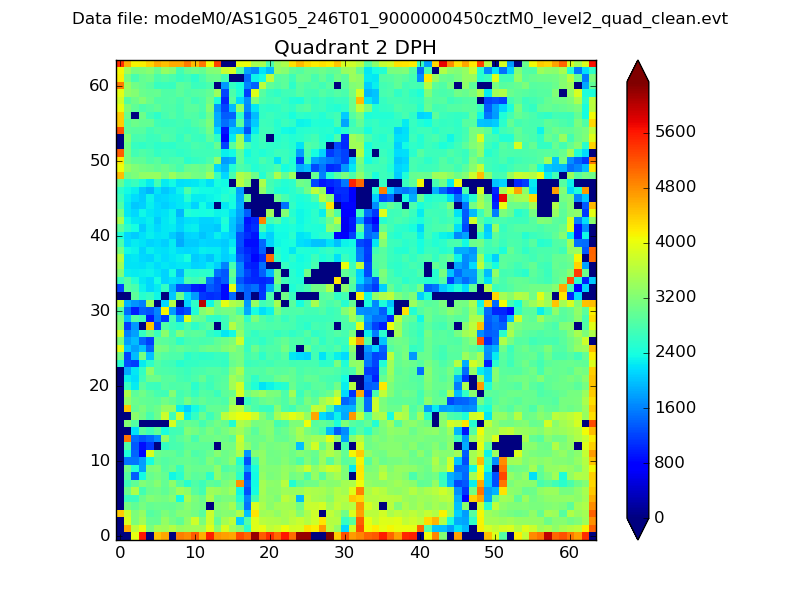 |
Quadrant C |
| Plot type | Count rate plots | Images |
|---|---|---|
| Comparison with Poisson distribution Blue bars denote a histogram of data divided into 1 sec bins. Red curve is a Poisson curve with rate = median count rate of data. |
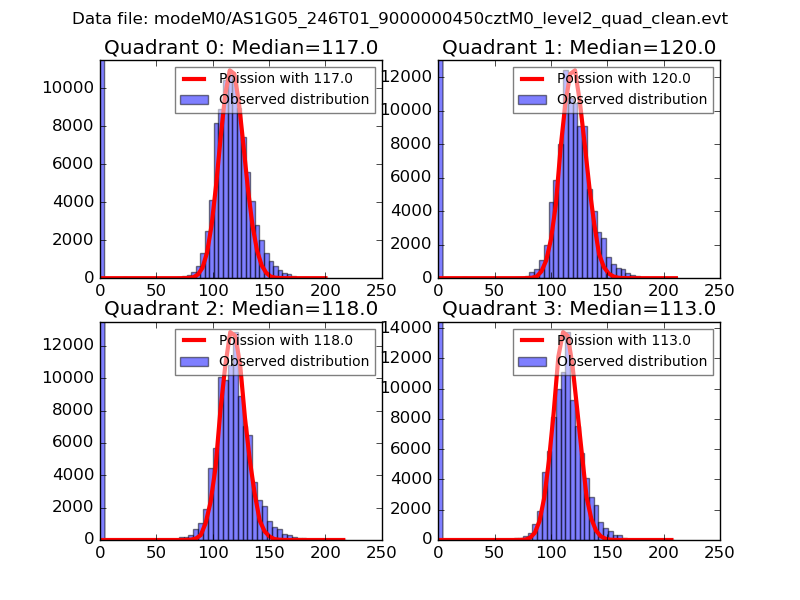 |
 |
| Quadrant-wise count rates Data is divided into 100 sec bins |
 |
|
| Module-wise count rates for Quadrant A Data is divided into 100 sec bins |
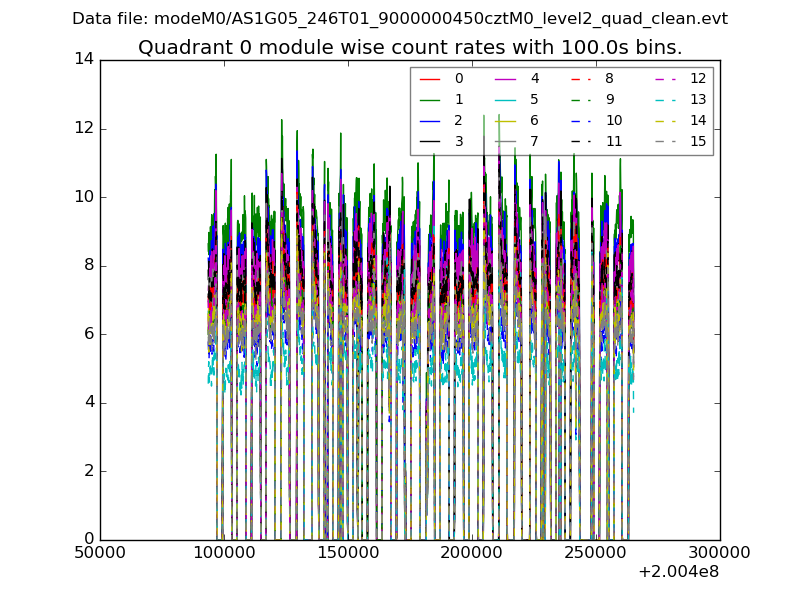 |
 |
| Module-wise count rates for Quadrant B Data is divided into 100 sec bins |
 |
 |
| Module-wise count rates for Quadrant C Data is divided into 100 sec bins |
 |
 |
| Module-wise count rates for Quadrant D Data is divided into 100 sec bins |
 |
 |
| Parameter | Plot |
|---|---|
| CZT HV Monitor |  |
| D_VDD |  |
| Temperature 1 |  |
| Veto HV Monitor |  |
| Veto LLD | 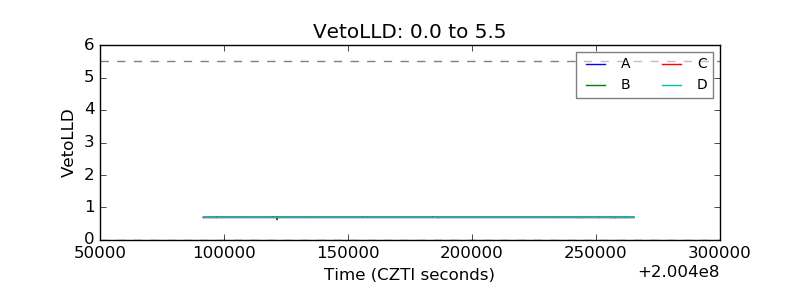 |
| Alpha Counter |  |
| _CPM_Rate | 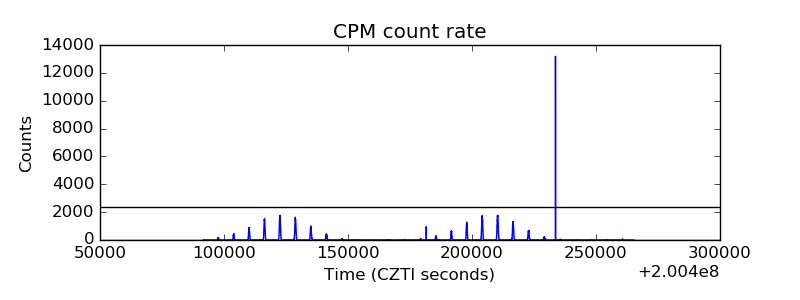 |
| CZT Counter |  |
| +2.5 Volts monitor |  |
| +5 Volts monitor | 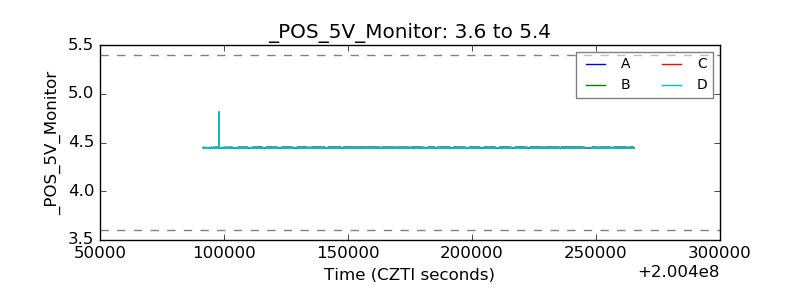 |
| _ROLL_ROT |  |
| _Roll_DEC | 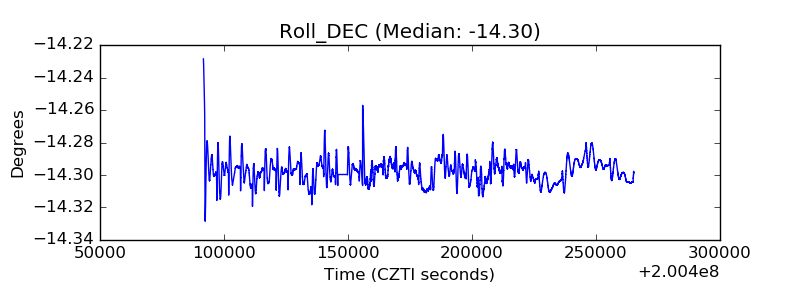 |
| _Roll_RA |  |
| Veto Counter |  |