| Param | Original file | Final file |
|---|---|---|
| Filename | modeM0/AS1G05_241T02_9000000448cztM0_level2.evt | modeM0/AS1G05_241T02_9000000448cztM0_level2_quad_clean.evt |
| Size (bytes) | 8,239,492,800 | 1,364,014,080 |
| Size | 7.7 GB | 1.3 GB |
| Events in quadrant A | 54,334,940 | 8,394,314 |
| Events in quadrant B | 76,103,664 | 8,518,590 |
| Events in quadrant C | 55,307,742 | 8,479,969 |
| Events in quadrant D | 56,129,149 | 8,135,075 |
| Mode M9 | |||
|---|---|---|---|
| Quadrant | BADHDUFLAG | Total packets | Discarded packets |
| A | 0 | 150 | 0 |
| B | 0 | 150 | 0 |
| C | 0 | 150 | 0 |
| D | 0 | 150 | 0 |
| Mode SS | |||
|---|---|---|---|
| Quadrant | BADHDUFLAG | Total packets | Discarded packets |
| A | 0 | 2310 | 0 |
| B | 0 | 2310 | 0 |
| C | 0 | 2310 | 0 |
| D | 0 | 2310 | 0 |
| Mode M0 | |||
|---|---|---|---|
| Quadrant | BADHDUFLAG | Total packets | Discarded packets |
| A | 0 | 242220 | 0 |
| B | 0 | 302676 | 0 |
| C | 0 | 243504 | 0 |
| D | 0 | 251279 | 0 |
| Quadrant | Total seconds | Saturated seconds | Saturation percentage |
|---|---|---|---|
| A | 113592 | 2603 | 2.291535% |
| B | 113592 | 3564 | 3.137545% |
| C | 113592 | 1915 | 1.685858% |
| D | 113590 | 2639 | 2.323268% |
Noise dominated data is calculated using 1-second bins in cleaned event files. If a bin has >2000 counts, and if more than 50% of those come from <1% of pixels, then it is considered to be noise-dominated and hence unusable.
| Quadrant | # 1 sec bins | Bins with >0 counts | Bins with >2000 counts | High rate bins dominated by noise | Noise dominated (total time) | Noise dominated (detector-on time) | Marked lightcurve |
|---|---|---|---|---|---|---|---|
| A | 131176 | 113620 | 521 | 521 | 0.40% | 0.46% |  |
| B | 131176 | 113620 | 572 | 572 | 0.44% | 0.50% |  |
| C | 131176 | 113620 | 449 | 449 | 0.34% | 0.40% |  |
| D | 131176 | 113619 | 1096 | 1096 | 0.84% | 0.96% |  |
Top three noisy pixels from each quadrant. If the there are fewer than three noisy pixels in the level2.evt file, extra rows are filled as -1
| Pixel properties | Quadrant properties | ||||||
|---|---|---|---|---|---|---|---|
| Quadrant | DetID | PixID | Counts | Sigma | Mean | Median | Sigma |
| A | 0 | 50 | 2287348 | 837.34 | 13264 | 12951 | 2716.2 |
| A | 8 | 15 | 453713 | 162.27 | 13264 | 12951 | 2716.2 |
| A | 0 | 118 | 422807 | 150.89 | 13264 | 12951 | 2716.2 |
| B | 15 | 204 | 20268925 | 7855.62 | 13382 | 13067 | 2578.5 |
| B | 2 | 249 | 1123728 | 430.74 | 13382 | 13067 | 2578.5 |
| B | 3 | 0 | 836029 | 319.16 | 13382 | 13067 | 2578.5 |
| C | 1 | 192 | 1658902 | 538.64 | 13020 | 13072 | 3055.5 |
| C | 14 | 223 | 817155 | 263.16 | 13020 | 13072 | 3055.5 |
| C | 8 | 208 | 548582 | 175.26 | 13020 | 13072 | 3055.5 |
| D | 13 | 223 | 3440262 | 1092.4 | 12932 | 12542 | 3137.8 |
| D | 10 | 172 | 840882 | 263.99 | 12932 | 12542 | 3137.8 |
| D | 12 | 233 | 749793 | 234.96 | 12932 | 12542 | 3137.8 |
Histogram calculated using DETX and DETY for each event in the final _common_clean file
| Quadrant A | 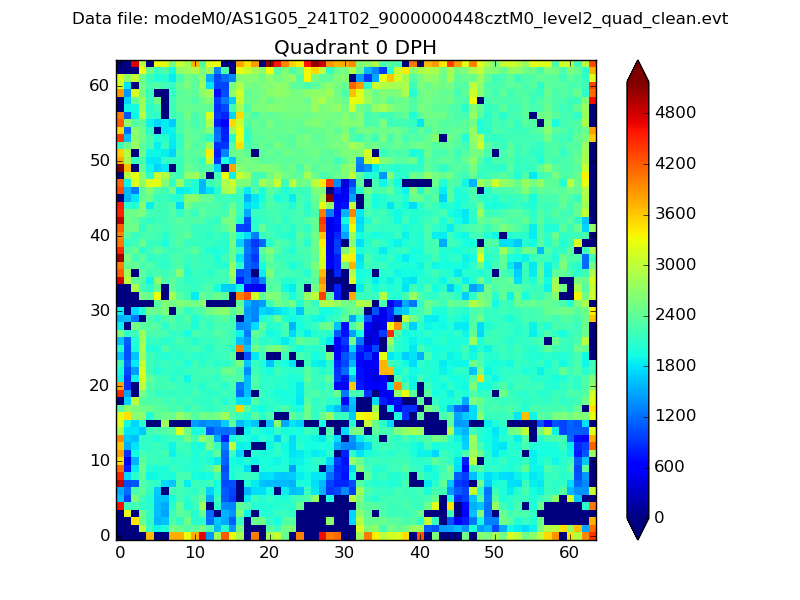 |
 |
Quadrant B |
|---|---|---|---|
| Quadrant D |  |
 |
Quadrant C |
| Plot type | Count rate plots | Images |
|---|---|---|
| Comparison with Poisson distribution Blue bars denote a histogram of data divided into 1 sec bins. Red curve is a Poisson curve with rate = median count rate of data. |
 |
 |
| Quadrant-wise count rates Data is divided into 100 sec bins |
 |
|
| Module-wise count rates for Quadrant A Data is divided into 100 sec bins |
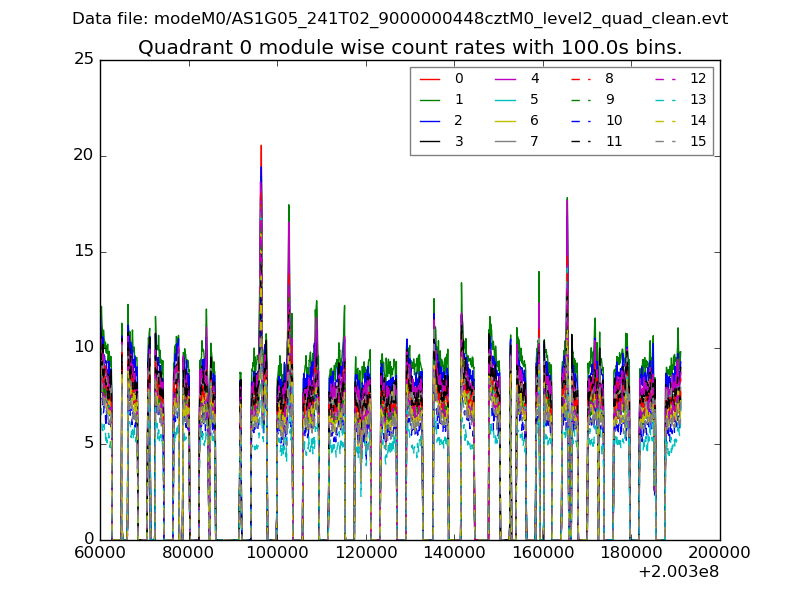 |
 |
| Module-wise count rates for Quadrant B Data is divided into 100 sec bins |
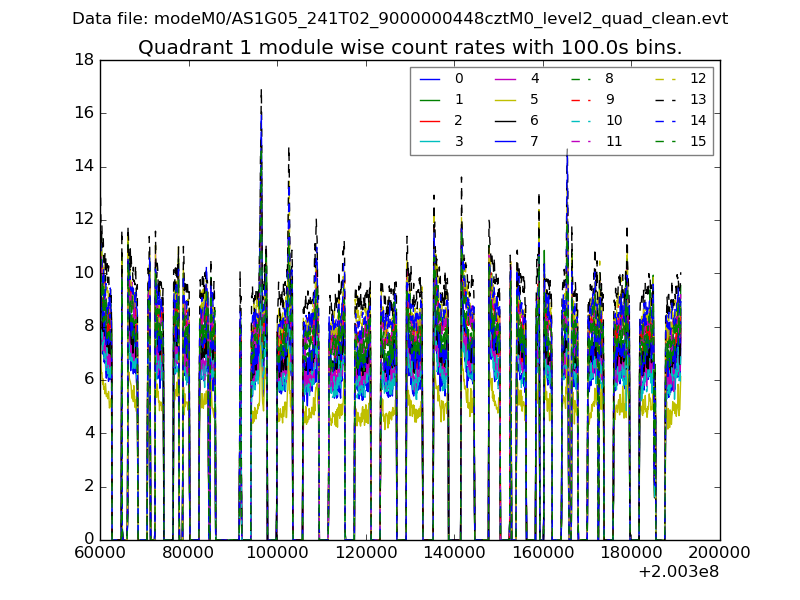 |
 |
| Module-wise count rates for Quadrant C Data is divided into 100 sec bins |
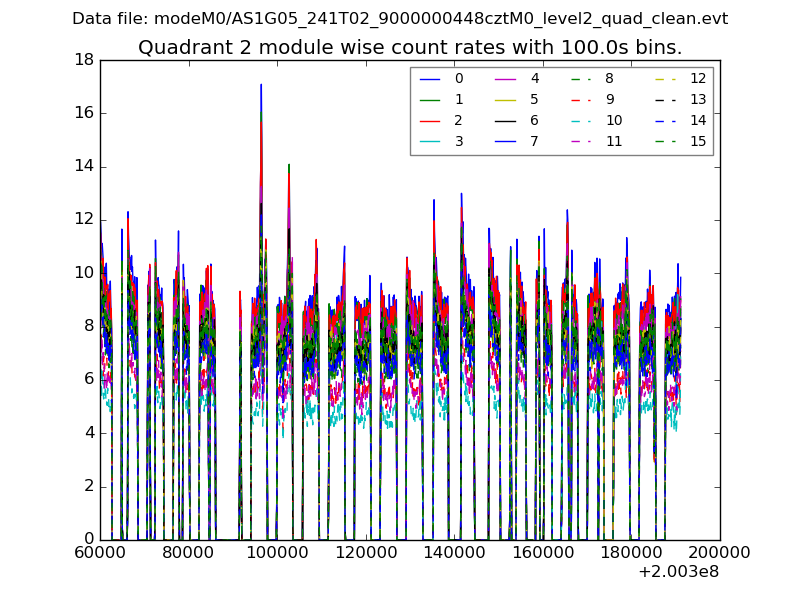 |
 |
| Module-wise count rates for Quadrant D Data is divided into 100 sec bins |
 |
 |
| Parameter | Plot |
|---|---|
| CZT HV Monitor |  |
| D_VDD | 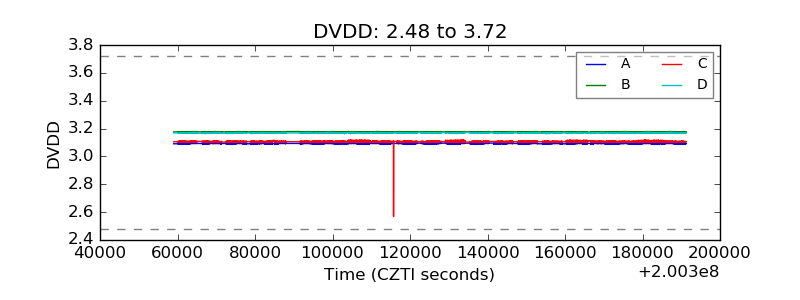 |
| Temperature 1 |  |
| Veto HV Monitor |  |
| Veto LLD |  |
| Alpha Counter |  |
| _CPM_Rate |  |
| CZT Counter |  |
| +2.5 Volts monitor |  |
| +5 Volts monitor |  |
| _ROLL_ROT |  |
| _Roll_DEC | 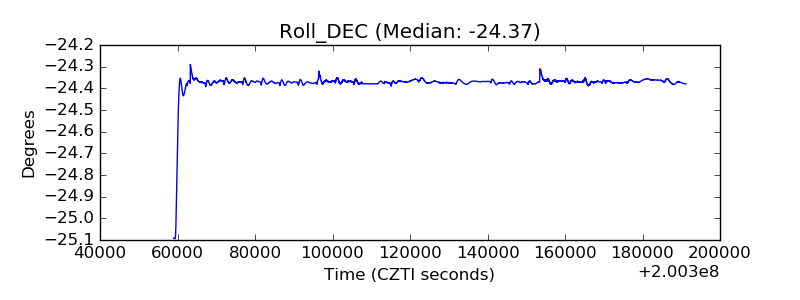 |
| _Roll_RA | 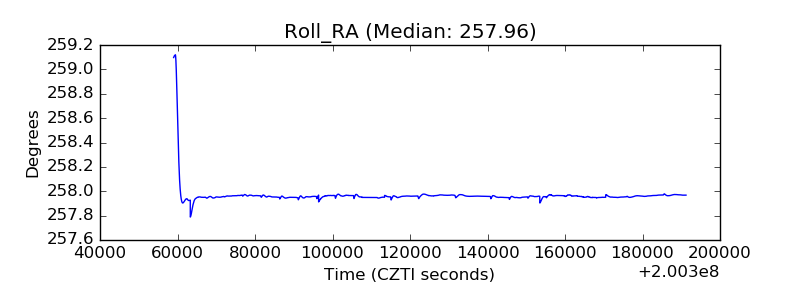 |
| Veto Counter | 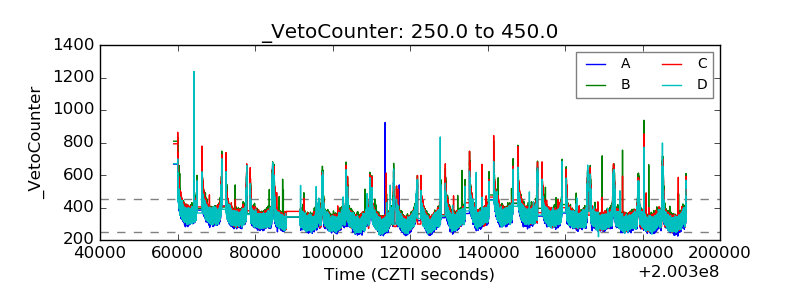 |