| Param | Original file | Final file |
|---|---|---|
| Filename | modeM0/AS1G05_228T02_9000000446cztM0_level2.evt | modeM0/AS1G05_228T02_9000000446cztM0_level2_quad_clean.evt |
| Size (bytes) | 2,328,422,400 | 384,851,520 |
| Size | 2.2 GB | 367.0 MB |
| Events in quadrant A | 15,391,059 | 2,401,135 |
| Events in quadrant B | 19,368,039 | 2,416,740 |
| Events in quadrant C | 17,690,625 | 2,459,299 |
| Events in quadrant D | 15,867,080 | 2,140,083 |
| Mode M0 | |||
|---|---|---|---|
| Quadrant | BADHDUFLAG | Total packets | Discarded packets |
| A | 0 | 68440 | 0 |
| B | 0 | 78064 | 0 |
| C | 0 | 75015 | 0 |
| D | 0 | 71283 | 0 |
| Mode SS | |||
|---|---|---|---|
| Quadrant | BADHDUFLAG | Total packets | Discarded packets |
| A | 0 | 666 | 0 |
| B | 0 | 671 | 0 |
| C | 0 | 669 | 0 |
| D | 0 | 650 | 0 |
| Mode M9 | |||
|---|---|---|---|
| Quadrant | BADHDUFLAG | Total packets | Discarded packets |
| A | 0 | 55 | 0 |
| B | 0 | 66 | 0 |
| C | 0 | 55 | 0 |
| D | 0 | 68 | 0 |
| Quadrant | Total seconds | Saturated seconds | Saturation percentage |
|---|---|---|---|
| A | 32587 | 565 | 1.733820% |
| B | 32341 | 694 | 2.145883% |
| C | 32786 | 555 | 1.692796% |
| D | 32612 | 536 | 1.643567% |
Noise dominated data is calculated using 1-second bins in cleaned event files. If a bin has >2000 counts, and if more than 50% of those come from <1% of pixels, then it is considered to be noise-dominated and hence unusable.
| Quadrant | # 1 sec bins | Bins with >0 counts | Bins with >2000 counts | High rate bins dominated by noise | Noise dominated (total time) | Noise dominated (detector-on time) | Marked lightcurve |
|---|---|---|---|---|---|---|---|
| A | 96883 | 32905 | 107 | 107 | 0.11% | 0.33% |  |
| B | 96883 | 32412 | 144 | 144 | 0.15% | 0.44% |  |
| C | 96883 | 32997 | 256 | 256 | 0.26% | 0.78% |  |
| D | 96883 | 32915 | 293 | 293 | 0.30% | 0.89% |  |
Top three noisy pixels from each quadrant. If the there are fewer than three noisy pixels in the level2.evt file, extra rows are filled as -1
| Pixel properties | Quadrant properties | ||||||
|---|---|---|---|---|---|---|---|
| Quadrant | DetID | PixID | Counts | Sigma | Mean | Median | Sigma |
| A | 0 | 50 | 396051 | 505.68 | 3814 | 3733 | 775.8 |
| A | 0 | 118 | 231046 | 293.0 | 3814 | 3733 | 775.8 |
| A | 0 | 226 | 60411 | 73.06 | 3814 | 3733 | 775.8 |
| B | 15 | 204 | 3245364 | 4367.42 | 3837 | 3739 | 742.2 |
| B | 2 | 249 | 968213 | 1299.43 | 3837 | 3739 | 742.2 |
| B | 14 | 167 | 130678 | 171.02 | 3837 | 3739 | 742.2 |
| C | 1 | 192 | 885394 | 1015.85 | 3711 | 3726 | 867.9 |
| C | 14 | 223 | 719071 | 824.22 | 3711 | 3726 | 867.9 |
| C | 6 | 80 | 481646 | 550.66 | 3711 | 3726 | 867.9 |
| D | 13 | 223 | 1157193 | 1279.29 | 3686 | 3574 | 901.8 |
| D | 5 | 233 | 214107 | 233.47 | 3686 | 3574 | 901.8 |
| D | 13 | 239 | 194363 | 211.57 | 3686 | 3574 | 901.8 |
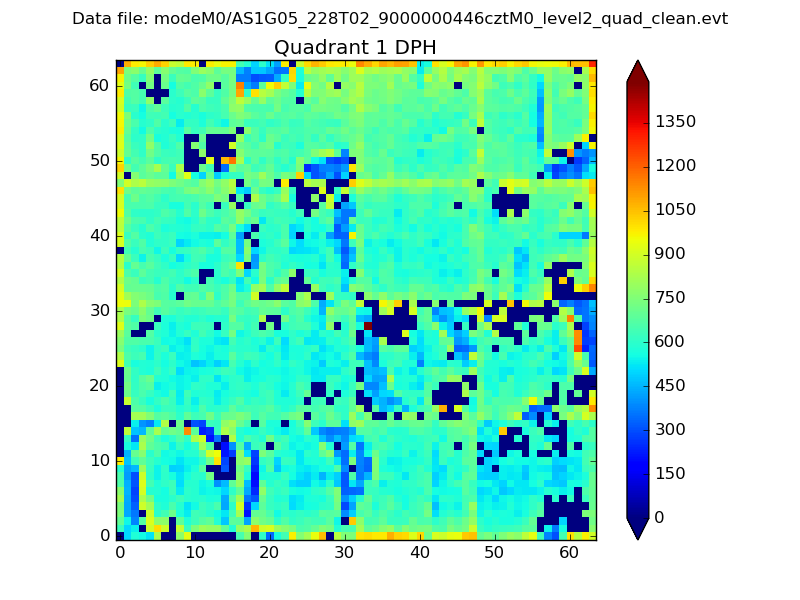
Histogram calculated using DETX and DETY for each event in the final _common_clean file
| Quadrant A |  |
 |
Quadrant B |
|---|---|---|---|
| Quadrant D |  |
 |
Quadrant C |
| Plot type | Count rate plots | Images |
|---|---|---|
| Comparison with Poisson distribution Blue bars denote a histogram of data divided into 1 sec bins. Red curve is a Poisson curve with rate = median count rate of data. |
 |
 |
| Quadrant-wise count rates Data is divided into 100 sec bins |
 |
|
| Module-wise count rates for Quadrant A Data is divided into 100 sec bins |
 |
 |
| Module-wise count rates for Quadrant B Data is divided into 100 sec bins |
 |
 |
| Module-wise count rates for Quadrant C Data is divided into 100 sec bins |
 |
 |
| Module-wise count rates for Quadrant D Data is divided into 100 sec bins |
 |
 |
| Parameter | Plot |
|---|---|
| CZT HV Monitor |  |
| D_VDD | 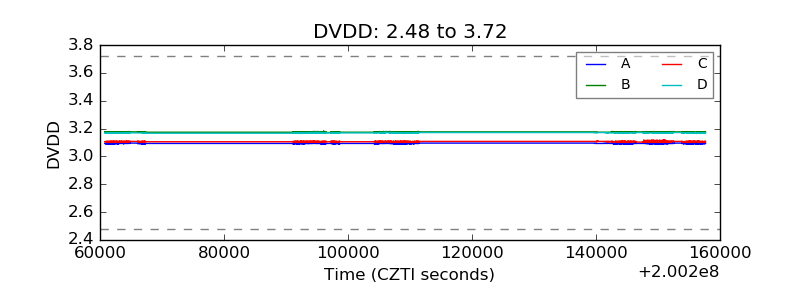 |
| Temperature 1 |  |
| Veto HV Monitor |  |
| Veto LLD |  |
| Alpha Counter | 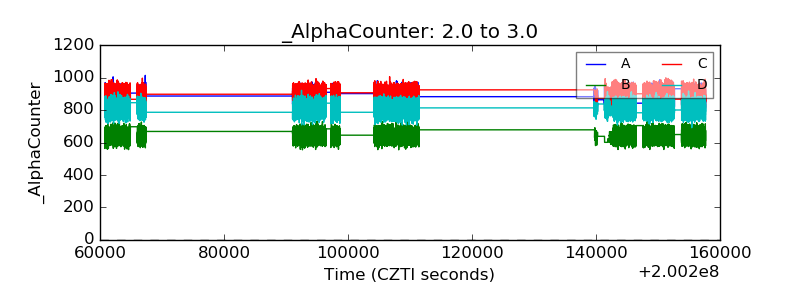 |
| _CPM_Rate |  |
| CZT Counter |  |
| +2.5 Volts monitor |  |
| +5 Volts monitor |  |
| _ROLL_ROT | 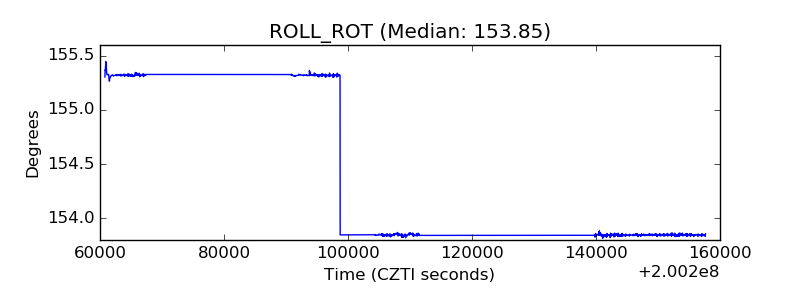 |
| _Roll_DEC | 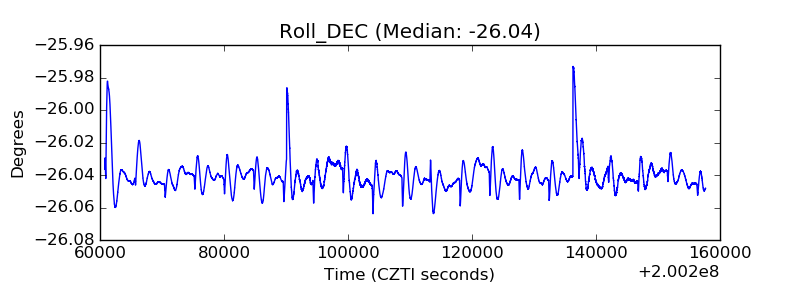 |
| _Roll_RA |  |
| Veto Counter |  |