| Param | Original file | Final file |
|---|---|---|
| Filename | modeM0/AS1G05_002T02_9000000444cztM0_level2.evt | modeM0/AS1G05_002T02_9000000444cztM0_level2_quad_clean.evt |
| Size (bytes) | 5,023,094,400 | 882,426,240 |
| Size | 4.7 GB | 841.5 MB |
| Events in quadrant A | 34,576,507 | 5,483,817 |
| Events in quadrant B | 44,360,991 | 5,566,541 |
| Events in quadrant C | 34,546,771 | 5,557,368 |
| Events in quadrant D | 33,954,309 | 5,354,848 |
| Mode SS | |||
|---|---|---|---|
| Quadrant | BADHDUFLAG | Total packets | Discarded packets |
| A | 0 | 1410 | 0 |
| B | 0 | 1410 | 0 |
| C | 0 | 1410 | 0 |
| D | 0 | 1410 | 0 |
| Mode M9 | |||
|---|---|---|---|
| Quadrant | BADHDUFLAG | Total packets | Discarded packets |
| A | 0 | 103 | 0 |
| B | 0 | 103 | 0 |
| C | 0 | 103 | 0 |
| D | 0 | 103 | 0 |
| Mode M0 | |||
|---|---|---|---|
| Quadrant | BADHDUFLAG | Total packets | Discarded packets |
| A | 0 | 152977 | 0 |
| B | 0 | 178639 | 0 |
| C | 0 | 152099 | 0 |
| D | 0 | 152870 | 0 |
| Quadrant | Total seconds | Saturated seconds | Saturation percentage |
|---|---|---|---|
| A | 69505 | 2076 | 2.986835% |
| B | 69505 | 1511 | 2.173944% |
| C | 69505 | 1305 | 1.877563% |
| D | 69505 | 1413 | 2.032947% |
Noise dominated data is calculated using 1-second bins in cleaned event files. If a bin has >2000 counts, and if more than 50% of those come from <1% of pixels, then it is considered to be noise-dominated and hence unusable.
| Quadrant | # 1 sec bins | Bins with >0 counts | Bins with >2000 counts | High rate bins dominated by noise | Noise dominated (total time) | Noise dominated (detector-on time) | Marked lightcurve |
|---|---|---|---|---|---|---|---|
| A | 79671 | 69517 | 853 | 853 | 1.07% | 1.23% |  |
| B | 79671 | 69517 | 163 | 163 | 0.20% | 0.23% |  |
| C | 79671 | 69517 | 496 | 496 | 0.62% | 0.71% |  |
| D | 79671 | 69517 | 652 | 652 | 0.82% | 0.94% | 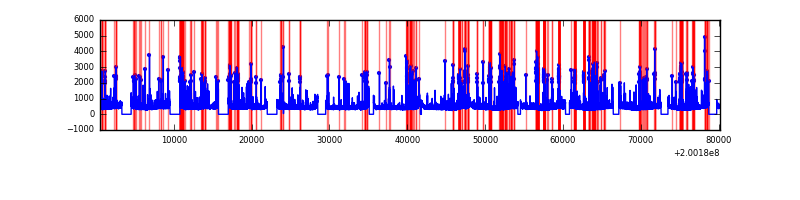 |
Top three noisy pixels from each quadrant. If the there are fewer than three noisy pixels in the level2.evt file, extra rows are filled as -1
| Pixel properties | Quadrant properties | ||||||
|---|---|---|---|---|---|---|---|
| Quadrant | DetID | PixID | Counts | Sigma | Mean | Median | Sigma |
| A | 0 | 50 | 2364636 | 1483.11 | 7826 | 7650 | 1589.2 |
| A | 14 | 249 | 1114762 | 696.64 | 7826 | 7650 | 1589.2 |
| A | 0 | 118 | 767742 | 478.28 | 7826 | 7650 | 1589.2 |
| B | 15 | 204 | 11390918 | 7489.36 | 8003 | 7805 | 1519.9 |
| B | 2 | 249 | 1327915 | 868.55 | 8003 | 7805 | 1519.9 |
| B | 5 | 200 | 306956 | 196.82 | 8003 | 7805 | 1519.9 |
| C | 14 | 223 | 2491587 | 1416.19 | 7658 | 7673 | 1753.9 |
| C | 6 | 80 | 515960 | 289.8 | 7658 | 7673 | 1753.9 |
| C | 1 | 16 | 384990 | 215.12 | 7658 | 7673 | 1753.9 |
| D | 13 | 223 | 2031312 | 1103.15 | 7622 | 7377 | 1834.7 |
| D | 13 | 239 | 853228 | 461.03 | 7622 | 7377 | 1834.7 |
| D | 5 | 233 | 522826 | 280.95 | 7622 | 7377 | 1834.7 |
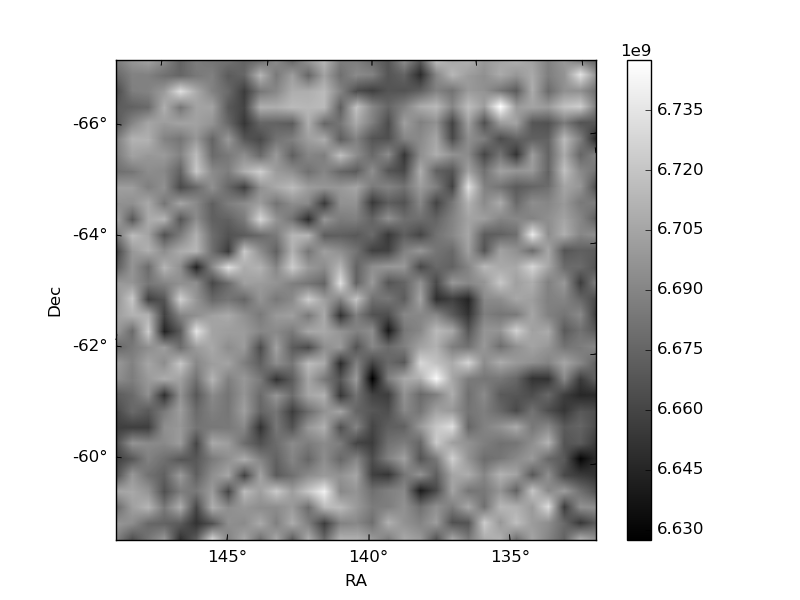
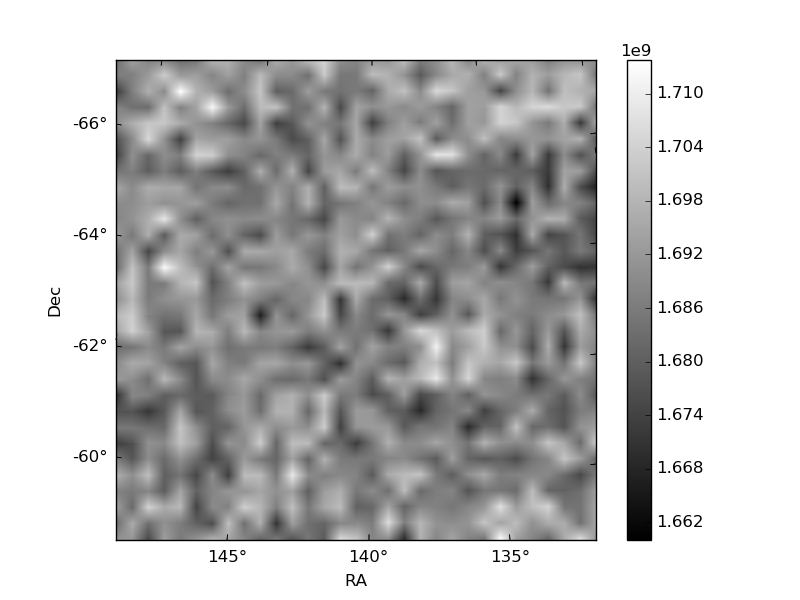
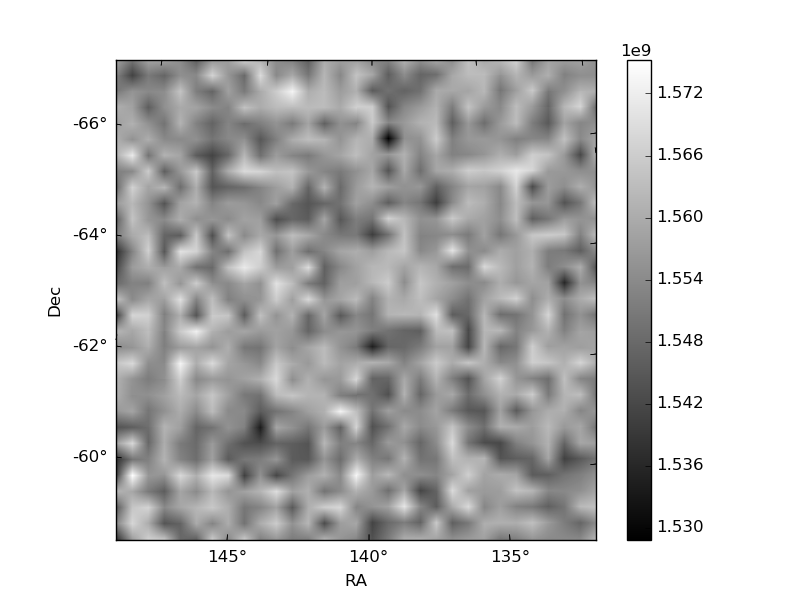
Histogram calculated using DETX and DETY for each event in the final _common_clean file
| Quadrant A |  |
 |
Quadrant B |
|---|---|---|---|
| Quadrant D |  |
 |
Quadrant C |
| Plot type | Count rate plots | Images |
|---|---|---|
| Comparison with Poisson distribution Blue bars denote a histogram of data divided into 1 sec bins. Red curve is a Poisson curve with rate = median count rate of data. |
 |
 |
| Quadrant-wise count rates Data is divided into 100 sec bins |
 |
|
| Module-wise count rates for Quadrant A Data is divided into 100 sec bins |
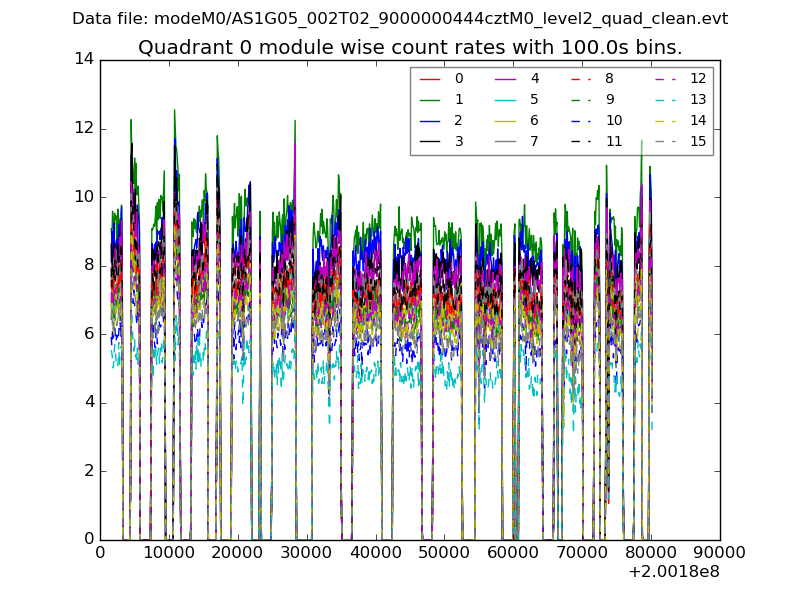 |
 |
| Module-wise count rates for Quadrant B Data is divided into 100 sec bins |
 |
 |
| Module-wise count rates for Quadrant C Data is divided into 100 sec bins |
 |
 |
| Module-wise count rates for Quadrant D Data is divided into 100 sec bins |
 |
 |
| Parameter | Plot |
|---|---|
| CZT HV Monitor | 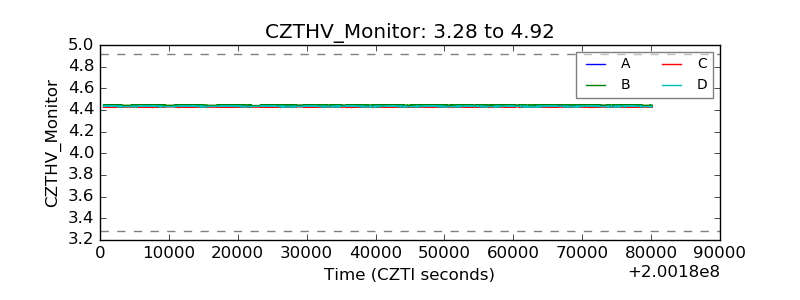 |
| D_VDD | 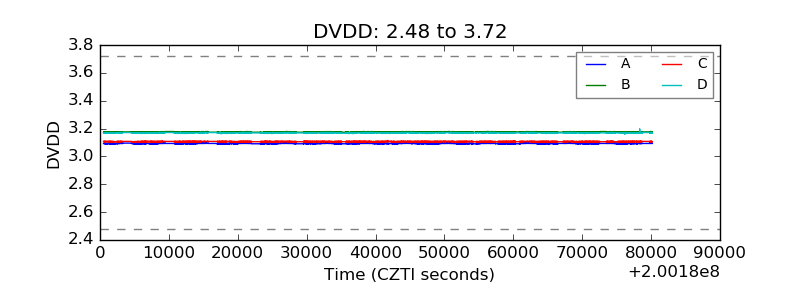 |
| Temperature 1 |  |
| Veto HV Monitor | 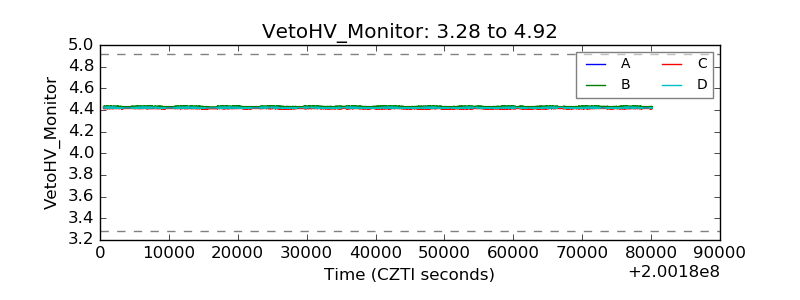 |
| Veto LLD |  |
| Alpha Counter | 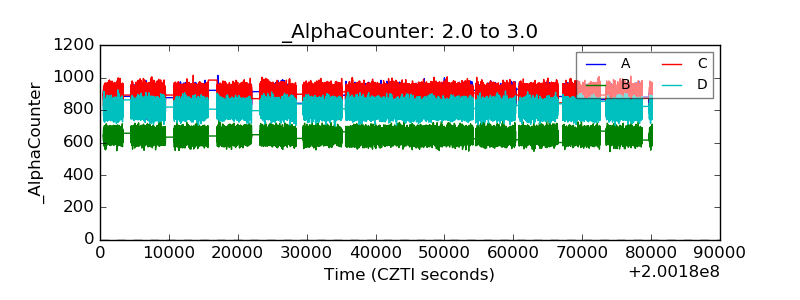 |
| _CPM_Rate | 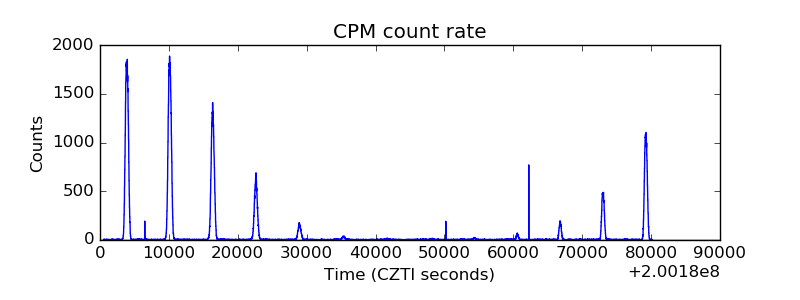 |
| CZT Counter |  |
| +2.5 Volts monitor |  |
| +5 Volts monitor |  |
| _ROLL_ROT | 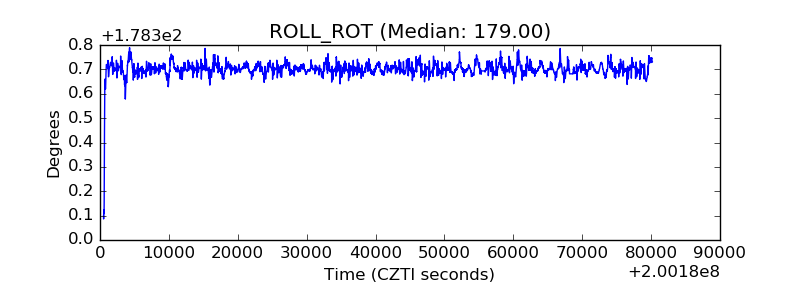 |
| _Roll_DEC | 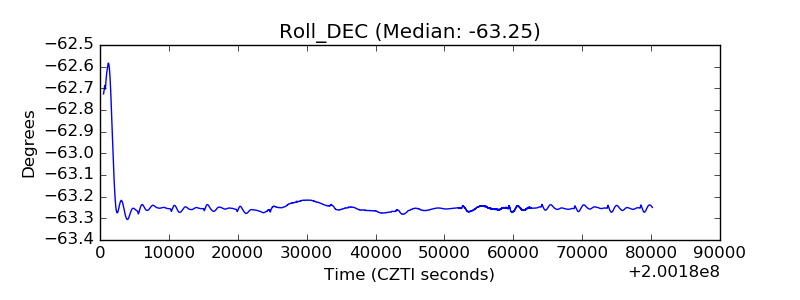 |
| _Roll_RA |  |
| Veto Counter |  |