| Param | Original file | Final file |
|---|---|---|
| Filename | modeM0/AS1G05_221T01_9000000442cztM0_level2_bc.evt | modeM0/AS1G05_221T01_9000000442cztM0_level2_quad_clean.evt |
| Size (bytes) | 2,735,614,080 | 851,673,600 |
| Size | 2.5 GB | 812.2 MB |
| Events in quadrant A | 14,641,523 | 5,342,368 |
| Events in quadrant B | 21,238,126 | 5,353,413 |
| Events in quadrant C | 23,978,123 | 5,171,716 |
| Events in quadrant D | 18,183,506 | 5,088,772 |
| Mode M0 | |||
|---|---|---|---|
| Quadrant | BADHDUFLAG | Total packets | Discarded packets |
| A | 0 | 148489 | 0 |
| B | 0 | 167166 | 0 |
| C | 0 | 178097 | 0 |
| D | 0 | 160036 | 0 |
| Mode SS | |||
|---|---|---|---|
| Quadrant | BADHDUFLAG | Total packets | Discarded packets |
| A | 0 | 1434 | 0 |
| B | 0 | 1434 | 0 |
| C | 0 | 1434 | 0 |
| D | 0 | 1434 | 0 |
| Mode M9 | |||
|---|---|---|---|
| Quadrant | BADHDUFLAG | Total packets | Discarded packets |
| A | 0 | 104 | 0 |
| B | 0 | 104 | 0 |
| C | 0 | 104 | 0 |
| D | 0 | 104 | 0 |
| Quadrant | Total seconds | Saturated seconds | Saturation percentage |
|---|---|---|---|
| A | 70572 | 1312 | 1.859094% |
| B | 70572 | 1495 | 2.118404% |
| C | 70572 | 3565 | 5.051579% |
| D | 70572 | 1774 | 2.513745% |
Noise dominated data is calculated using 1-second bins in cleaned event files. If a bin has >2000 counts, and if more than 50% of those come from <1% of pixels, then it is considered to be noise-dominated and hence unusable.
| Quadrant | # 1 sec bins | Bins with >0 counts | Bins with >2000 counts | High rate bins dominated by noise | Noise dominated (total time) | Noise dominated (detector-on time) | Marked lightcurve |
|---|---|---|---|---|---|---|---|
| A | 80782 | 70574 | 52 | 52 | 0.06% | 0.07% |  |
| B | 80782 | 70573 | 57 | 57 | 0.07% | 0.08% | 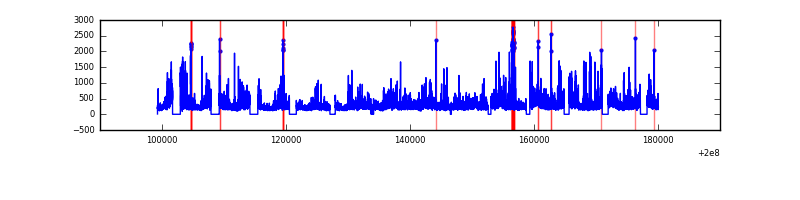 |
| C | 80782 | 70574 | 1100 | 1100 | 1.36% | 1.56% | 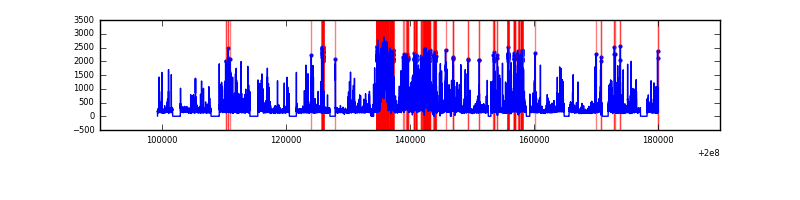 |
| D | 80782 | 70575 | 82 | 82 | 0.10% | 0.12% |  |
Top three noisy pixels from each quadrant. If the there are fewer than three noisy pixels in the level2.evt file, extra rows are filled as -1
| Pixel properties | Quadrant properties | ||||||
|---|---|---|---|---|---|---|---|
| Quadrant | DetID | PixID | Counts | Sigma | Mean | Median | Sigma |
| A | 0 | 118 | 773016 | 1023.09 | 3373 | 3309 | 752.3 |
| A | 0 | 50 | 332049 | 436.96 | 3373 | 3309 | 752.3 |
| A | 3 | 1 | 215890 | 282.56 | 3373 | 3309 | 752.3 |
| B | 15 | 204 | 6340054 | 9541.36 | 3425 | 3331 | 664.1 |
| B | 2 | 249 | 671013 | 1005.34 | 3425 | 3331 | 664.1 |
| B | 5 | 200 | 638278 | 956.06 | 3425 | 3331 | 664.1 |
| C | 1 | 192 | 5588456 | 7649.08 | 3272 | 3234 | 730.2 |
| C | 14 | 223 | 3787198 | 5182.22 | 3272 | 3234 | 730.2 |
| C | 12 | 175 | 1018748 | 1390.77 | 3272 | 3234 | 730.2 |
| D | 13 | 223 | 1543958 | 1962.17 | 3313 | 3197 | 785.2 |
| D | 13 | 114 | 1396238 | 1774.04 | 3313 | 3197 | 785.2 |
| D | 12 | 233 | 1229883 | 1562.19 | 3313 | 3197 | 785.2 |
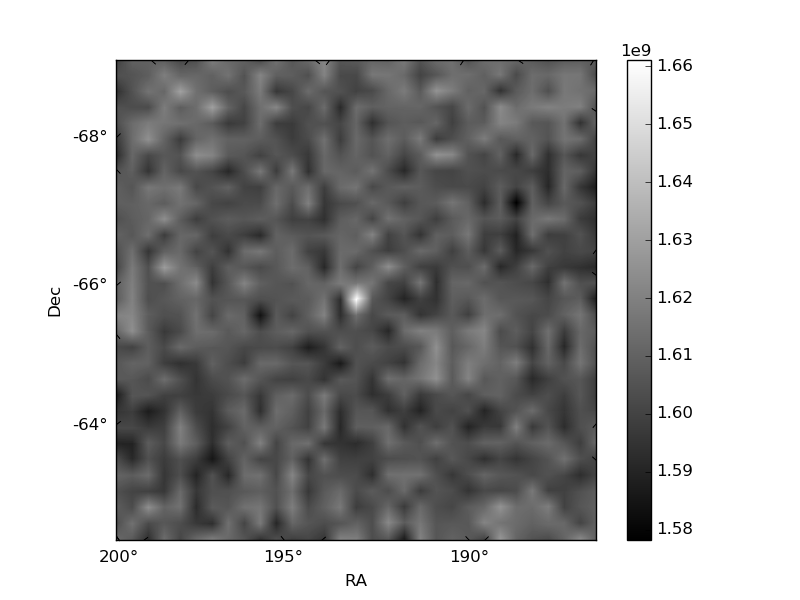
Histogram calculated using DETX and DETY for each event in the final _common_clean file
| Quadrant A |  |
 |
Quadrant B |
|---|---|---|---|
| Quadrant D | 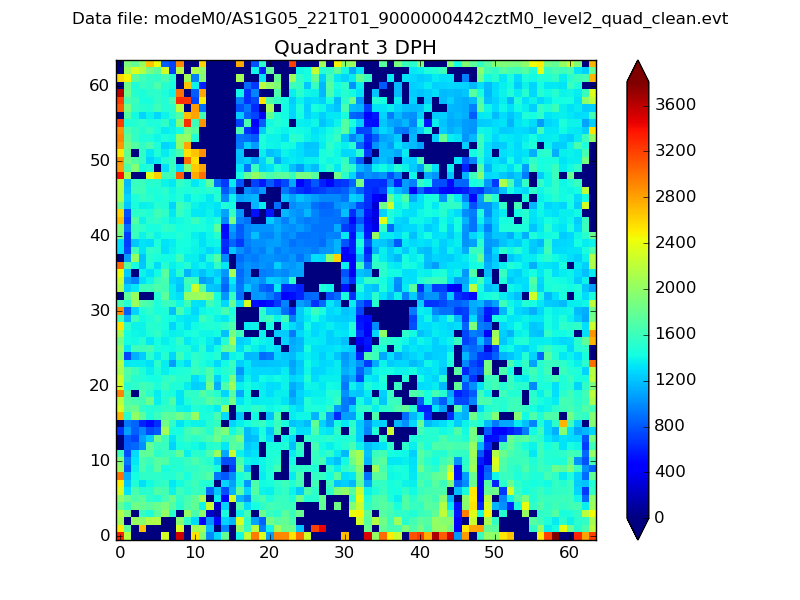 |
 |
Quadrant C |
| Plot type | Count rate plots | Images |
|---|---|---|
| Comparison with Poisson distribution Blue bars denote a histogram of data divided into 1 sec bins. Red curve is a Poisson curve with rate = median count rate of data. |
 |
 |
| Quadrant-wise count rates Data is divided into 100 sec bins |
 |
|
| Module-wise count rates for Quadrant A Data is divided into 100 sec bins |
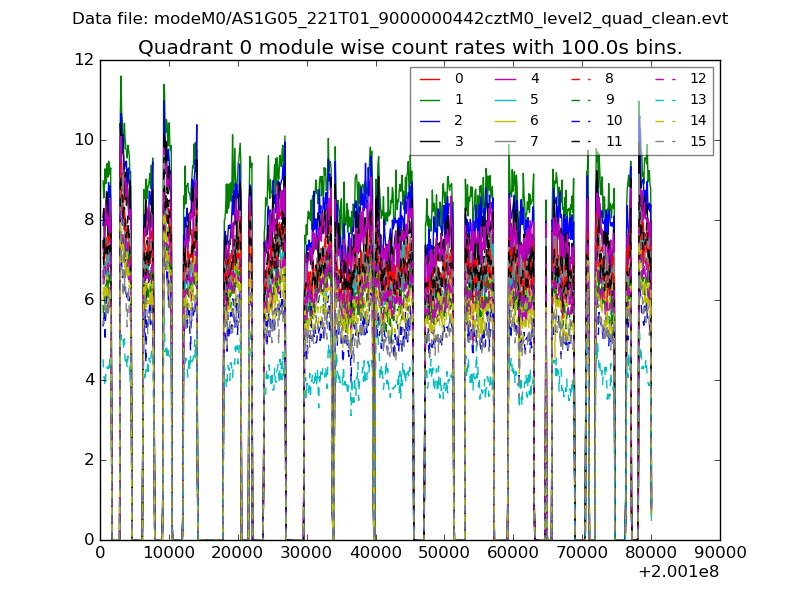 |
 |
| Module-wise count rates for Quadrant B Data is divided into 100 sec bins |
 |
 |
| Module-wise count rates for Quadrant C Data is divided into 100 sec bins |
 |
 |
| Module-wise count rates for Quadrant D Data is divided into 100 sec bins |
 |
 |
| Parameter | Plot |
|---|---|
| CZT HV Monitor |  |
| D_VDD |  |
| Temperature 1 |  |
| Veto HV Monitor |  |
| Veto LLD | 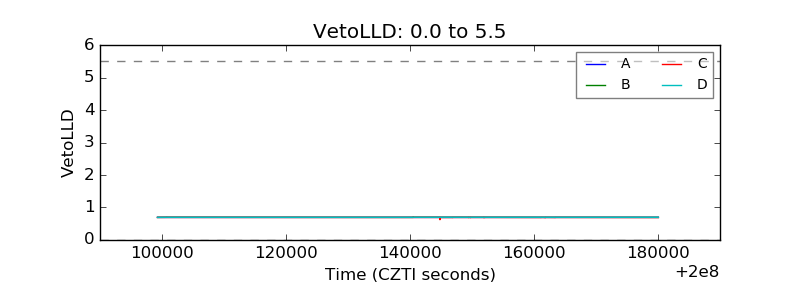 |
| Alpha Counter |  |
| _CPM_Rate | 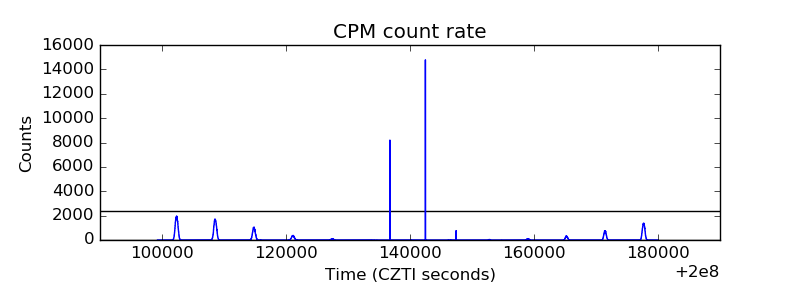 |
| CZT Counter |  |
| +2.5 Volts monitor |  |
| +5 Volts monitor |  |
| _ROLL_ROT |  |
| _Roll_DEC | 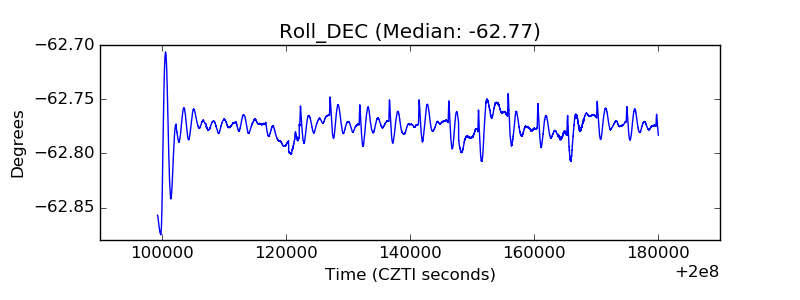 |
| _Roll_RA |  |
| Veto Counter | 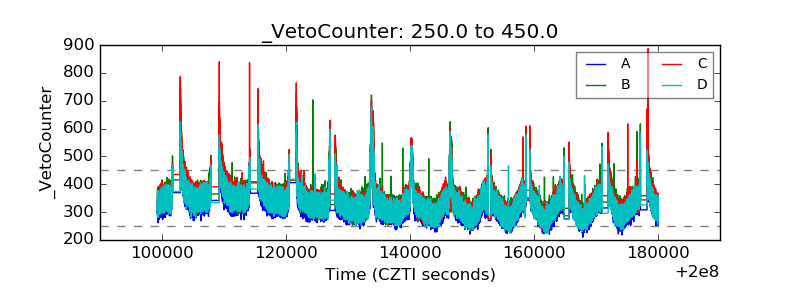 |