| Param | Original file | Final file |
|---|---|---|
| Filename | modeM0/AS1G05_104T01_9000000440cztM0_level2_bc.evt | modeM0/AS1G05_104T01_9000000440cztM0_level2_quad_clean.evt |
| Size (bytes) | 3,561,589,440 | 1,184,909,760 |
| Size | 3.3 GB | 1.1 GB |
| Events in quadrant A | 20,050,339 | 7,440,312 |
| Events in quadrant B | 29,121,053 | 7,408,515 |
| Events in quadrant C | 24,194,127 | 7,306,375 |
| Events in quadrant D | 27,818,797 | 7,012,780 |
| Mode SS | |||
|---|---|---|---|
| Quadrant | BADHDUFLAG | Total packets | Discarded packets |
| A | 0 | 2000 | 0 |
| B | 0 | 2000 | 0 |
| C | 0 | 2000 | 0 |
| D | 0 | 2000 | 0 |
| Mode M0 | |||
|---|---|---|---|
| Quadrant | BADHDUFLAG | Total packets | Discarded packets |
| A | 0 | 203750 | 0 |
| B | 0 | 230557 | 0 |
| C | 0 | 216507 | 0 |
| D | 0 | 228004 | 0 |
| Mode M9 | |||
|---|---|---|---|
| Quadrant | BADHDUFLAG | Total packets | Discarded packets |
| A | 0 | 147 | 0 |
| B | 0 | 147 | 0 |
| C | 0 | 147 | 0 |
| D | 0 | 147 | 0 |
| Quadrant | Total seconds | Saturated seconds | Saturation percentage |
|---|---|---|---|
| A | 98077 | 1366 | 1.392783% |
| B | 98077 | 1496 | 1.525332% |
| C | 98077 | 1648 | 1.680312% |
| D | 98077 | 2203 | 2.246194% |
Noise dominated data is calculated using 1-second bins in cleaned event files. If a bin has >2000 counts, and if more than 50% of those come from <1% of pixels, then it is considered to be noise-dominated and hence unusable.
| Quadrant | # 1 sec bins | Bins with >0 counts | Bins with >2000 counts | High rate bins dominated by noise | Noise dominated (total time) | Noise dominated (detector-on time) | Marked lightcurve |
|---|---|---|---|---|---|---|---|
| A | 112806 | 98078 | 71 | 71 | 0.06% | 0.07% |  |
| B | 112806 | 98078 | 22 | 22 | 0.02% | 0.02% |  |
| C | 112806 | 98079 | 74 | 74 | 0.07% | 0.08% |  |
| D | 112806 | 98078 | 330 | 330 | 0.29% | 0.34% |  |
Top three noisy pixels from each quadrant. If the there are fewer than three noisy pixels in the level2.evt file, extra rows are filled as -1
| Pixel properties | Quadrant properties | ||||||
|---|---|---|---|---|---|---|---|
| Quadrant | DetID | PixID | Counts | Sigma | Mean | Median | Sigma |
| A | 0 | 118 | 777921 | 714.88 | 4779 | 4714 | 1081.6 |
| A | 0 | 50 | 361771 | 330.12 | 4779 | 4714 | 1081.6 |
| A | 0 | 149 | 180097 | 162.15 | 4779 | 4714 | 1081.6 |
| B | 15 | 204 | 8761649 | 9182.51 | 4848 | 4736 | 953.7 |
| B | 2 | 249 | 456039 | 473.24 | 4848 | 4736 | 953.7 |
| B | 7 | 252 | 248977 | 256.11 | 4848 | 4736 | 953.7 |
| C | 14 | 223 | 2119274 | 2003.78 | 4681 | 4643 | 1055.3 |
| C | 14 | 48 | 2026758 | 1916.11 | 4681 | 4643 | 1055.3 |
| C | 6 | 80 | 629093 | 591.72 | 4681 | 4643 | 1055.3 |
| D | 13 | 114 | 5141528 | 4616.03 | 4663 | 4508 | 1112.9 |
| D | 13 | 223 | 2954669 | 2650.96 | 4663 | 4508 | 1112.9 |
| D | 13 | 239 | 524201 | 466.99 | 4663 | 4508 | 1112.9 |
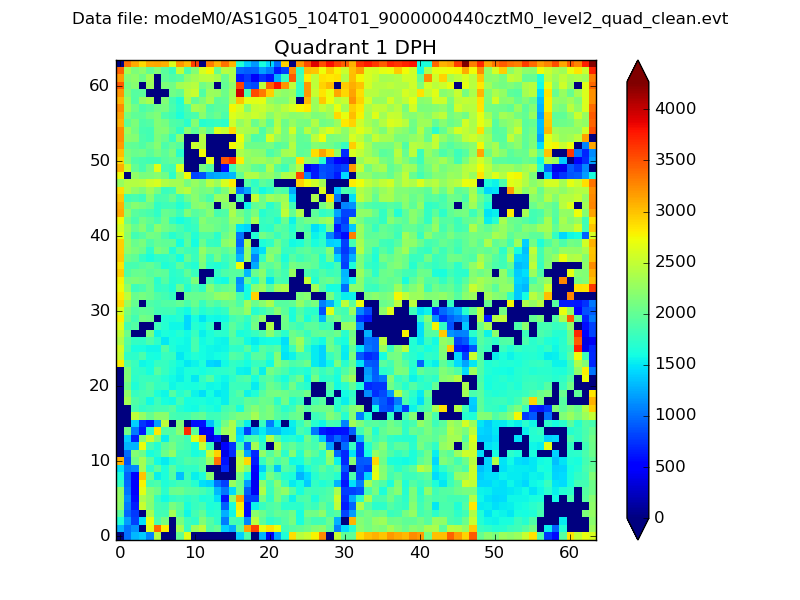
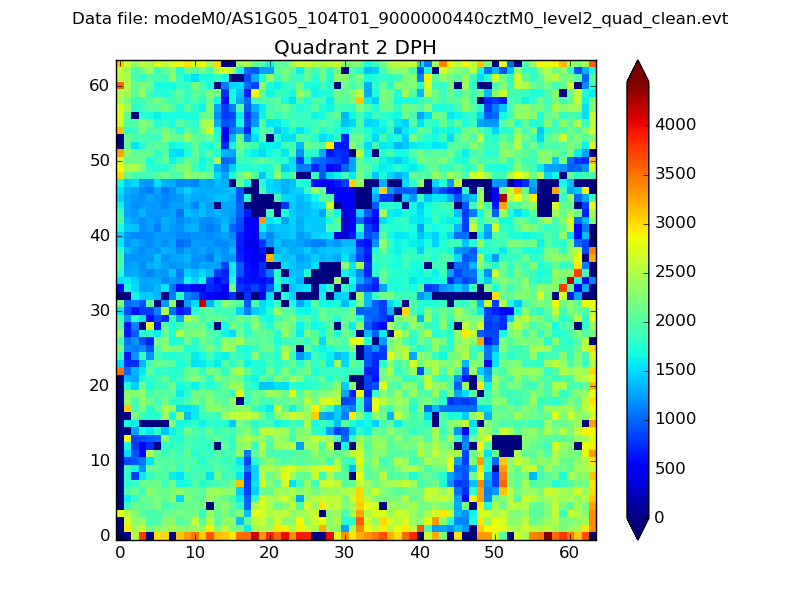
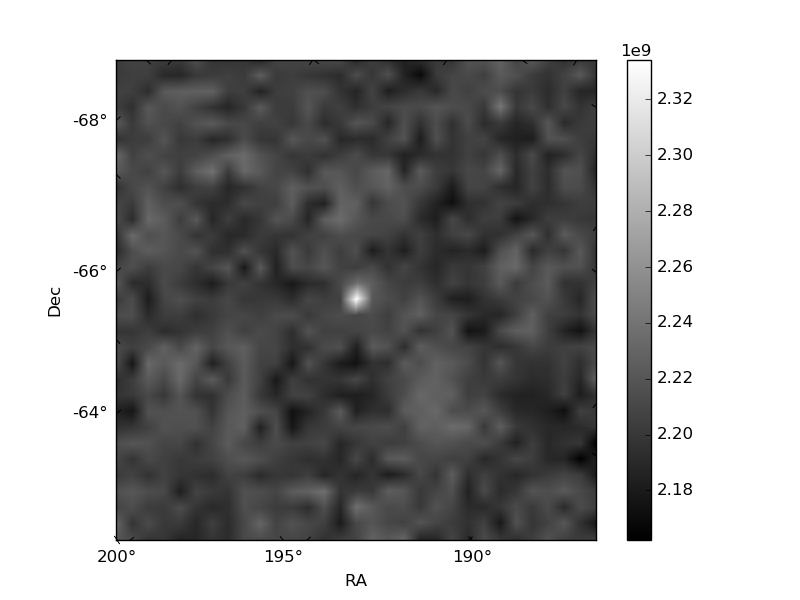
Histogram calculated using DETX and DETY for each event in the final _common_clean file
| Quadrant A |  |
 |
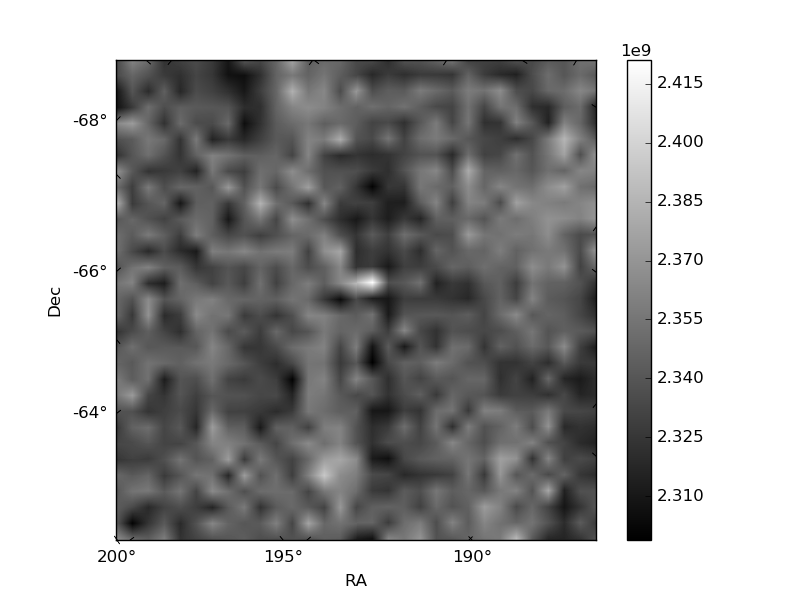
Quadrant B |
|---|---|---|---|
| Quadrant D |  |
 |
Quadrant C |
| Plot type | Count rate plots | Images |
|---|---|---|
| Comparison with Poisson distribution Blue bars denote a histogram of data divided into 1 sec bins. Red curve is a Poisson curve with rate = median count rate of data. |
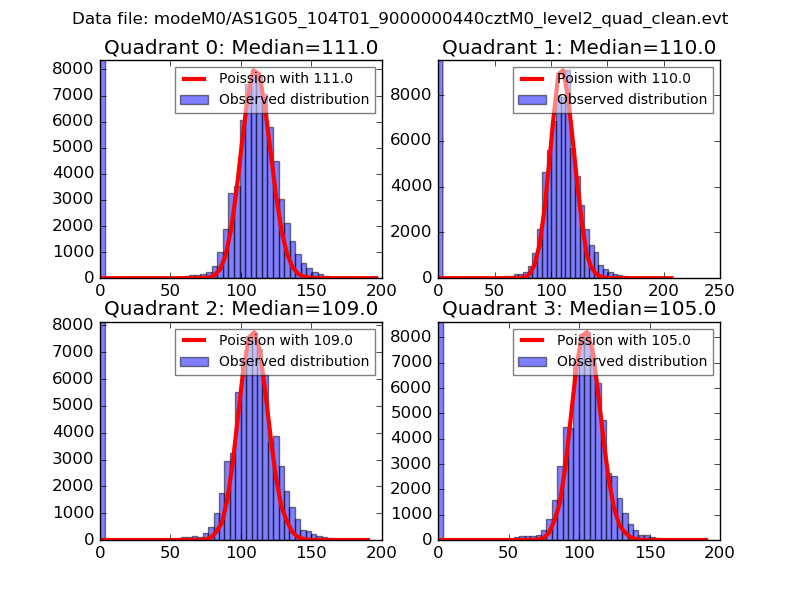 |
 |
| Quadrant-wise count rates Data is divided into 100 sec bins |
 |
|
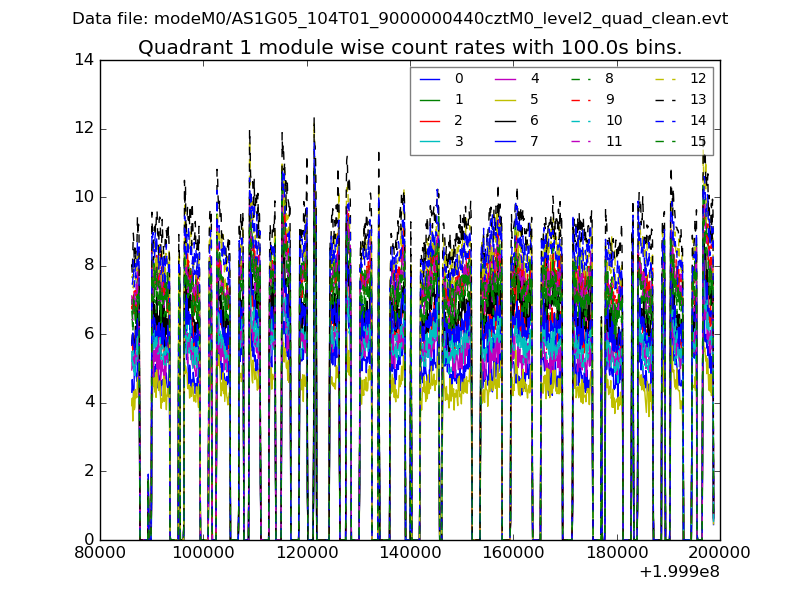
| Module-wise count rates for Quadrant A Data is divided into 100 sec bins |
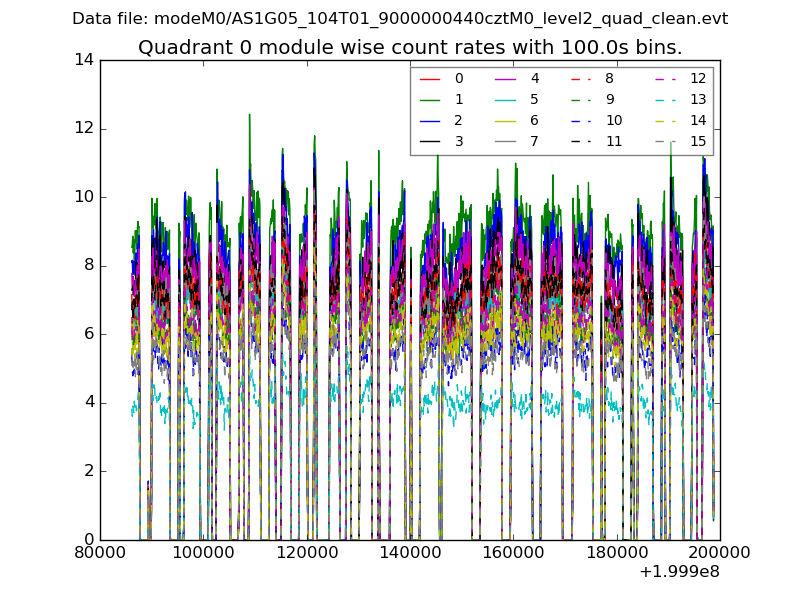 |
 |
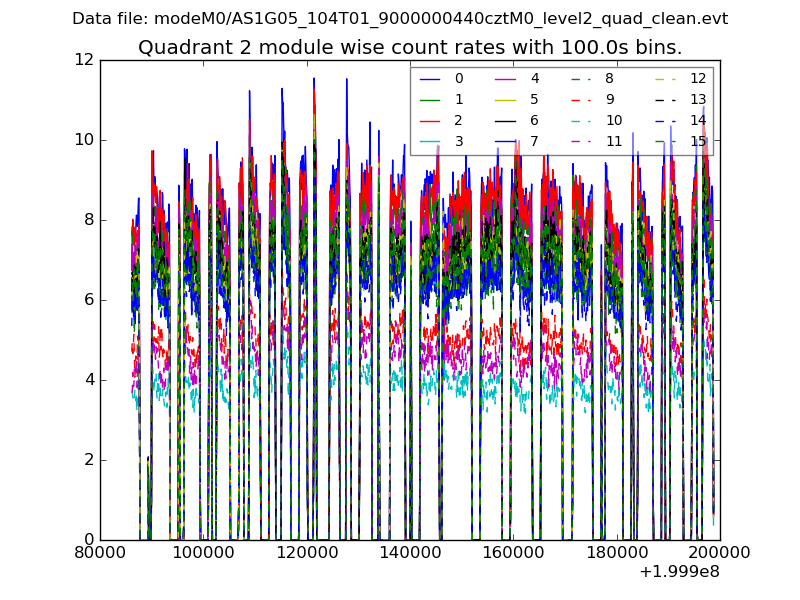
| Module-wise count rates for Quadrant B Data is divided into 100 sec bins |
 |
 |
| Module-wise count rates for Quadrant C Data is divided into 100 sec bins |
 |
 |
| Module-wise count rates for Quadrant D Data is divided into 100 sec bins |
 |
 |
| Parameter | Plot |
|---|---|
| CZT HV Monitor | 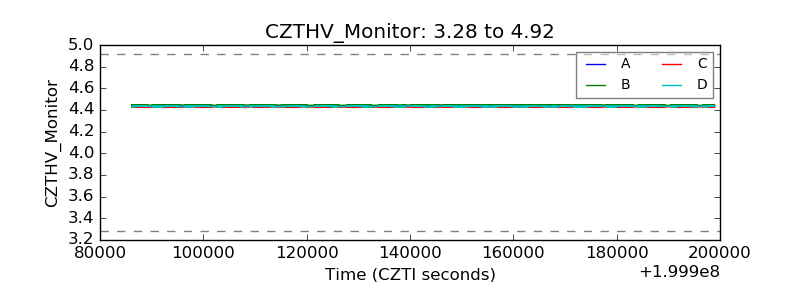 |
| D_VDD |  |
| Temperature 1 |  |
| Veto HV Monitor |  |
| Veto LLD |  |
| Alpha Counter |  |
| _CPM_Rate |  |
| CZT Counter |  |
| +2.5 Volts monitor |  |
| +5 Volts monitor |  |
| _ROLL_ROT |  |
| _Roll_DEC |  |
| _Roll_RA | 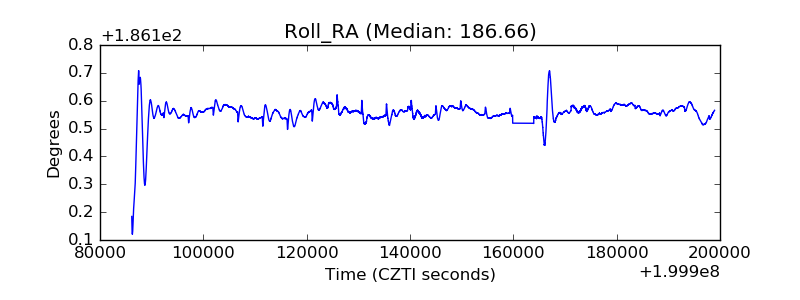 |
| Veto Counter |  |