| Param | Original file | Final file |
|---|---|---|
| Filename | modeM0/AS1G05_221T01_9000000438cztM0_level2_bc.evt | modeM0/AS1G05_221T01_9000000438cztM0_level2_quad_clean.evt |
| Size (bytes) | 1,940,135,040 | 583,997,760 |
| Size | 1.8 GB | 556.9 MB |
| Events in quadrant A | 16,028,468 | 3,525,907 |
| Events in quadrant B | 14,706,127 | 3,570,231 |
| Events in quadrant C | 12,918,679 | 3,583,802 |
| Events in quadrant D | 11,568,287 | 3,451,270 |
| Mode M9 | |||
|---|---|---|---|
| Quadrant | BADHDUFLAG | Total packets | Discarded packets |
| A | 0 | 66 | 0 |
| B | 0 | 66 | 0 |
| C | 0 | 66 | 0 |
| D | 0 | 66 | 0 |
| Mode M0 | |||
|---|---|---|---|
| Quadrant | BADHDUFLAG | Total packets | Discarded packets |
| A | 0 | 129766 | 0 |
| B | 0 | 119358 | 0 |
| C | 0 | 116241 | 0 |
| D | 0 | 111521 | 0 |
| Mode SS | |||
|---|---|---|---|
| Quadrant | BADHDUFLAG | Total packets | Discarded packets |
| A | 0 | 1050 | 0 |
| B | 0 | 1050 | 0 |
| C | 0 | 1050 | 0 |
| D | 0 | 1050 | 0 |
| Quadrant | Total seconds | Saturated seconds | Saturation percentage |
|---|---|---|---|
| A | 51844 | 3266 | 6.299668% |
| B | 51844 | 1264 | 2.438083% |
| C | 51844 | 1724 | 3.325361% |
| D | 51844 | 882 | 1.701258% |
Noise dominated data is calculated using 1-second bins in cleaned event files. If a bin has >2000 counts, and if more than 50% of those come from <1% of pixels, then it is considered to be noise-dominated and hence unusable.
| Quadrant | # 1 sec bins | Bins with >0 counts | Bins with >2000 counts | High rate bins dominated by noise | Noise dominated (total time) | Noise dominated (detector-on time) | Marked lightcurve |
|---|---|---|---|---|---|---|---|
| A | 58363 | 51837 | 133 | 133 | 0.23% | 0.26% |  |
| B | 58363 | 51837 | 29 | 29 | 0.05% | 0.06% |  |
| C | 58363 | 51837 | 149 | 149 | 0.26% | 0.29% |  |
| D | 58363 | 51838 | 27 | 27 | 0.05% | 0.05% |  |
Top three noisy pixels from each quadrant. If the there are fewer than three noisy pixels in the level2.evt file, extra rows are filled as -1
| Pixel properties | Quadrant properties | ||||||
|---|---|---|---|---|---|---|---|
| Quadrant | DetID | PixID | Counts | Sigma | Mean | Median | Sigma |
| A | 0 | 199 | 2624225 | 4666.35 | 2489 | 2441 | 561.8 |
| A | 0 | 50 | 1887755 | 3355.56 | 2489 | 2441 | 561.8 |
| A | 0 | 118 | 1380238 | 2452.26 | 2489 | 2441 | 561.8 |
| B | 15 | 204 | 3347787 | 6653.21 | 2589 | 2521 | 502.8 |
| B | 2 | 249 | 369547 | 729.96 | 2589 | 2521 | 502.8 |
| B | 3 | 0 | 282902 | 557.63 | 2589 | 2521 | 502.8 |
| C | 14 | 223 | 2324678 | 4120.99 | 2506 | 2487 | 563.5 |
| C | 6 | 80 | 377109 | 664.81 | 2506 | 2487 | 563.5 |
| C | 1 | 192 | 199382 | 349.41 | 2506 | 2487 | 563.5 |
| D | 13 | 223 | 591395 | 994.73 | 2508 | 2422 | 592.1 |
| D | 13 | 120 | 411894 | 691.56 | 2508 | 2422 | 592.1 |
| D | 13 | 239 | 162617 | 270.56 | 2508 | 2422 | 592.1 |
Histogram calculated using DETX and DETY for each event in the final _common_clean file
| Quadrant A |  |
 |
Quadrant B |
|---|---|---|---|
| Quadrant D | 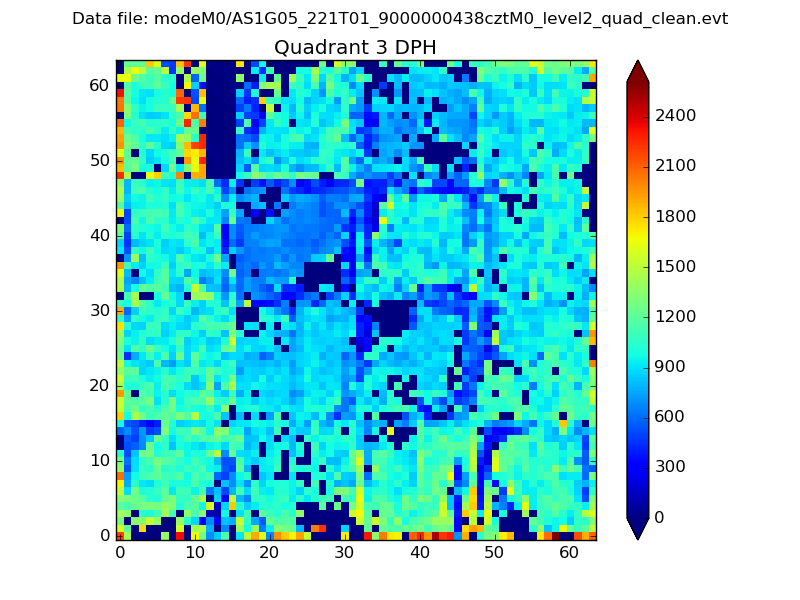 |
 |
Quadrant C |
| Plot type | Count rate plots | Images |
|---|---|---|
| Comparison with Poisson distribution Blue bars denote a histogram of data divided into 1 sec bins. Red curve is a Poisson curve with rate = median count rate of data. |
 |
 |
| Quadrant-wise count rates Data is divided into 100 sec bins |
 |
|
| Module-wise count rates for Quadrant A Data is divided into 100 sec bins |
 |
 |
| Module-wise count rates for Quadrant B Data is divided into 100 sec bins |
 |
 |
| Module-wise count rates for Quadrant C Data is divided into 100 sec bins |
 |
 |
| Module-wise count rates for Quadrant D Data is divided into 100 sec bins |
 |
 |
| Parameter | Plot |
|---|---|
| CZT HV Monitor |  |
| D_VDD |  |
| Temperature 1 | 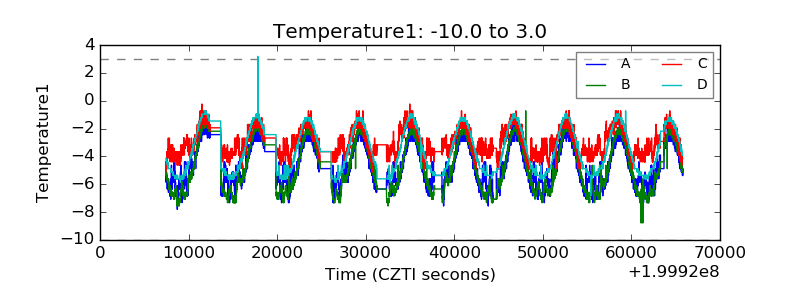 |
| Veto HV Monitor |  |
| Veto LLD | 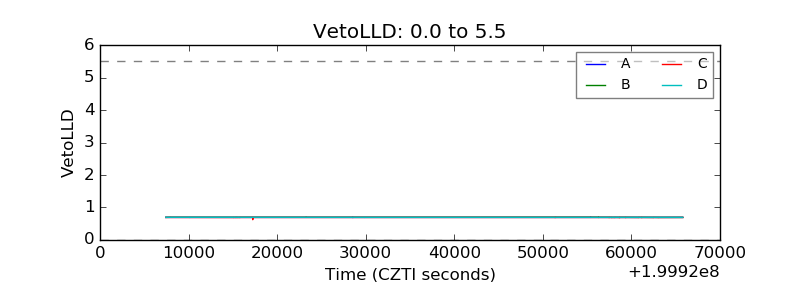 |
| Alpha Counter |  |
| _CPM_Rate |  |
| CZT Counter |  |
| +2.5 Volts monitor |  |
| +5 Volts monitor |  |
| _ROLL_ROT |  |
| _Roll_DEC |  |
| _Roll_RA | 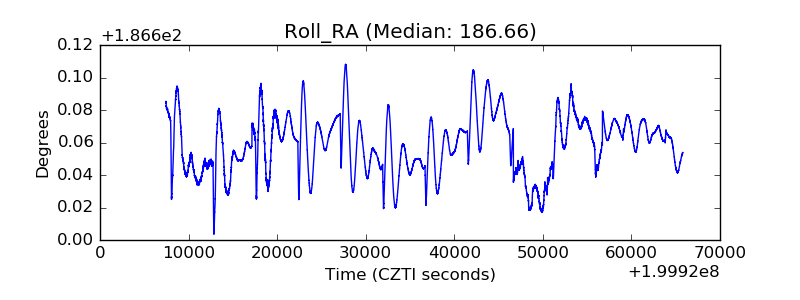 |
| Veto Counter |  |