| Param | Original file | Final file |
|---|---|---|
| Filename | modeM0/AS1G05_221T01_9000000438cztM0_level2.evt | modeM0/AS1G05_221T01_9000000438cztM0_level2_quad_clean.evt |
| Size (bytes) | 14,294,131,200 | 2,072,010,240 |
| Size | 13.3 GB | 1.9 GB |
| Events in quadrant A | 84,801,913 | 13,309,422 |
| Events in quadrant B | 86,066,600 | 13,532,165 |
| Events in quadrant C | 169,806,815 | 11,997,767 |
| Events in quadrant D | 81,341,880 | 12,834,249 |
| Mode M9 | |||
|---|---|---|---|
| Quadrant | BADHDUFLAG | Total packets | Discarded packets |
| A | 0 | 216 | 0 |
| B | 0 | 216 | 0 |
| C | 0 | 216 | 0 |
| D | 0 | 216 | 0 |
| Mode M0 | |||
|---|---|---|---|
| Quadrant | BADHDUFLAG | Total packets | Discarded packets |
| A | 0 | 365861 | 0 |
| B | 0 | 361503 | 0 |
| C | 0 | 617408 | 0 |
| D | 0 | 360155 | 0 |
| Mode SS | |||
|---|---|---|---|
| Quadrant | BADHDUFLAG | Total packets | Discarded packets |
| A | 0 | 3286 | 0 |
| B | 0 | 3286 | 0 |
| C | 0 | 3286 | 0 |
| D | 0 | 3286 | 0 |
| Quadrant | Total seconds | Saturated seconds | Saturation percentage |
|---|---|---|---|
| A | 161747 | 5088 | 3.145653% |
| B | 161747 | 2925 | 1.808380% |
| C | 161694 | 34790 | 21.515950% |
| D | 161596 | 2867 | 1.774178% |
Noise dominated data is calculated using 1-second bins in cleaned event files. If a bin has >2000 counts, and if more than 50% of those come from <1% of pixels, then it is considered to be noise-dominated and hence unusable.
| Quadrant | # 1 sec bins | Bins with >0 counts | Bins with >2000 counts | High rate bins dominated by noise | Noise dominated (total time) | Noise dominated (detector-on time) | Marked lightcurve |
|---|---|---|---|---|---|---|---|
| A | 183348 | 161759 | 2280 | 2280 | 1.24% | 1.41% |  |
| B | 183348 | 161757 | 325 | 325 | 0.18% | 0.20% |  |
| C | 183347 | 161700 | 33062 | 33062 | 18.03% | 20.45% |  |
| D | 183347 | 161616 | 1214 | 1214 | 0.66% | 0.75% |  |
Top three noisy pixels from each quadrant. If the there are fewer than three noisy pixels in the level2.evt file, extra rows are filled as -1
| Pixel properties | Quadrant properties | ||||||
|---|---|---|---|---|---|---|---|
| Quadrant | DetID | PixID | Counts | Sigma | Mean | Median | Sigma |
| A | 0 | 199 | 6698512 | 1792.66 | 18347 | 17938 | 3726.6 |
| A | 0 | 50 | 3167876 | 845.25 | 18347 | 17938 | 3726.6 |
| A | 0 | 118 | 2602633 | 693.57 | 18347 | 17938 | 3726.6 |
| B | 15 | 204 | 9396709 | 2644.62 | 18824 | 18388 | 3546.2 |
| B | 2 | 249 | 1442475 | 401.58 | 18824 | 18388 | 3546.2 |
| B | 3 | 0 | 409916 | 110.41 | 18824 | 18388 | 3546.2 |
| C | 12 | 206 | 86101591 | 22435.86 | 16630 | 16723 | 3836.9 |
| C | 1 | 192 | 9694895 | 2522.37 | 16630 | 16723 | 3836.9 |
| C | 14 | 223 | 5118603 | 1329.68 | 16630 | 16723 | 3836.9 |
| D | 13 | 223 | 4190433 | 970.51 | 17842 | 17306 | 4299.9 |
| D | 13 | 120 | 2918647 | 674.74 | 17842 | 17306 | 4299.9 |
| D | 5 | 233 | 1438714 | 330.57 | 17842 | 17306 | 4299.9 |
Histogram calculated using DETX and DETY for each event in the final _common_clean file
| Quadrant A |  |
 |
Quadrant B |
|---|---|---|---|
| Quadrant D | 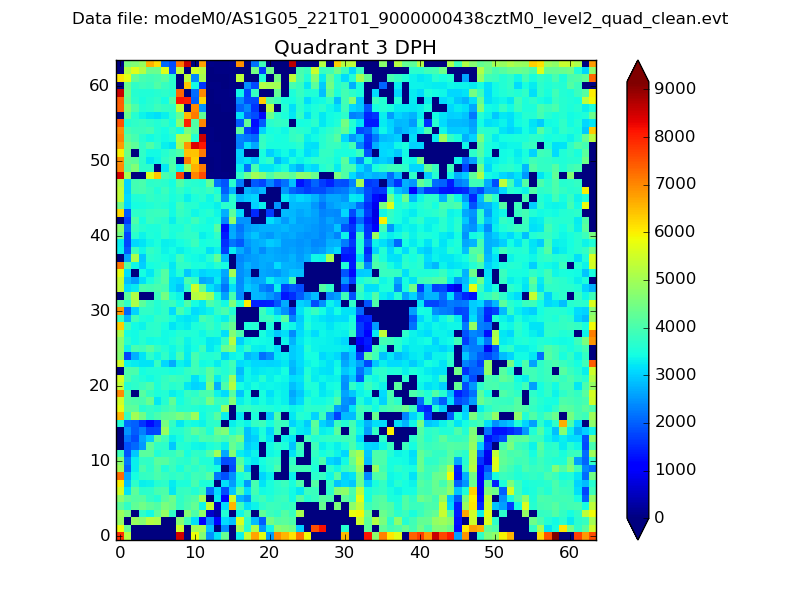 |
 |
Quadrant C |
| Plot type | Count rate plots | Images |
|---|---|---|
| Comparison with Poisson distribution Blue bars denote a histogram of data divided into 1 sec bins. Red curve is a Poisson curve with rate = median count rate of data. |
 |
 |
| Quadrant-wise count rates Data is divided into 100 sec bins |
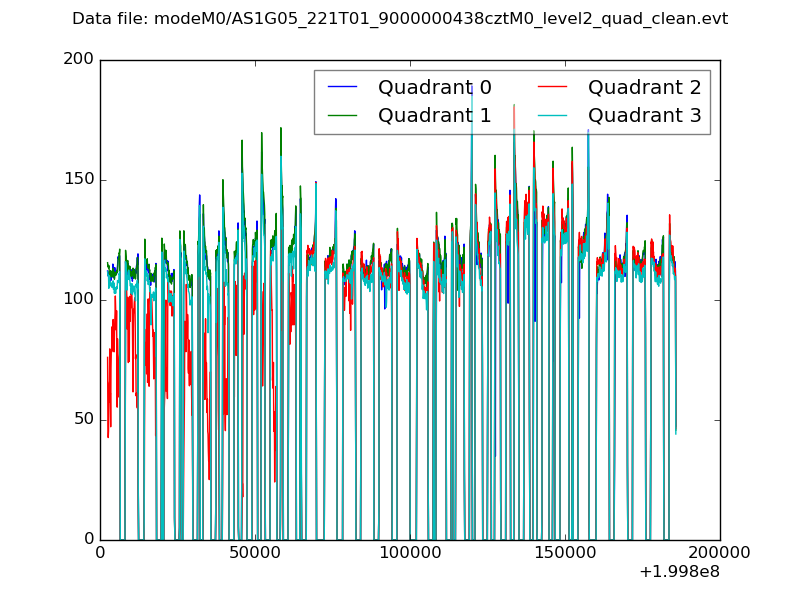 |
|
| Module-wise count rates for Quadrant A Data is divided into 100 sec bins |
 |
 |
| Module-wise count rates for Quadrant B Data is divided into 100 sec bins |
 |
 |
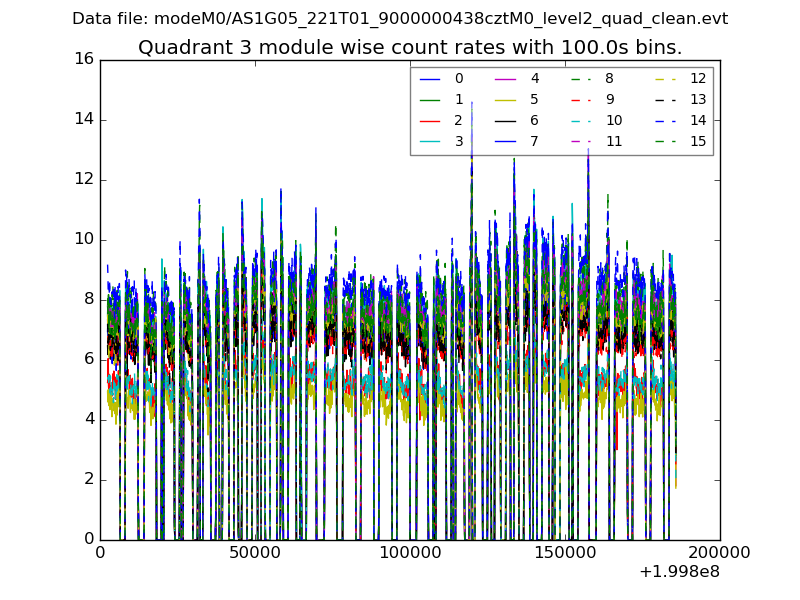
| Module-wise count rates for Quadrant C Data is divided into 100 sec bins |
 |
 |
| Module-wise count rates for Quadrant D Data is divided into 100 sec bins |
 |
 |
| Parameter | Plot |
|---|---|
| CZT HV Monitor |  |
| D_VDD | 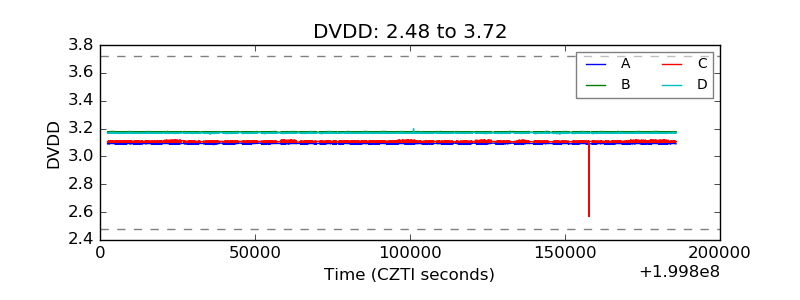 |
| Temperature 1 |  |
| Veto HV Monitor | 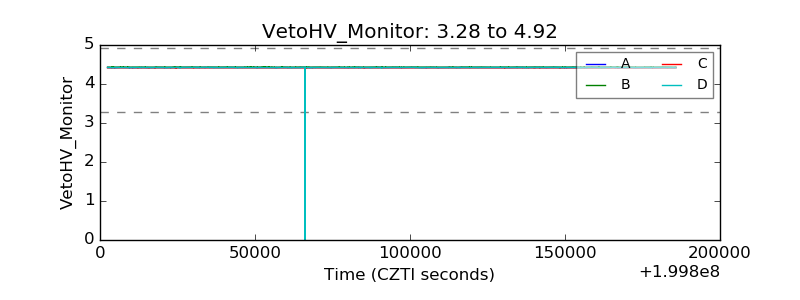 |
| Veto LLD |  |
| Alpha Counter |  |
| _CPM_Rate |  |
| CZT Counter |  |
| +2.5 Volts monitor |  |
| +5 Volts monitor |  |
| _ROLL_ROT |  |
| _Roll_DEC |  |
| _Roll_RA |  |
| Veto Counter |  |