| Param | Original file | Final file |
|---|---|---|
| Filename | modeM0/AS1G05_127T01_9000000436cztM0_level2_bc.evt | modeM0/AS1G05_127T01_9000000436cztM0_level2_quad_clean.evt |
| Size (bytes) | 4,771,267,200 | 1,100,373,120 |
| Size | 4.4 GB | 1.0 GB |
| Events in quadrant A | 19,553,397 | 7,063,469 |
| Events in quadrant B | 21,294,632 | 7,100,961 |
| Events in quadrant C | 74,605,263 | 5,980,640 |
| Events in quadrant D | 22,691,845 | 6,778,412 |
| Mode SS | |||
|---|---|---|---|
| Quadrant | BADHDUFLAG | Total packets | Discarded packets |
| A | 0 | 1896 | 0 |
| B | 0 | 1896 | 0 |
| C | 0 | 1896 | 0 |
| D | 0 | 1896 | 0 |
| Mode M9 | |||
|---|---|---|---|
| Quadrant | BADHDUFLAG | Total packets | Discarded packets |
| A | 0 | 149 | 0 |
| B | 0 | 149 | 0 |
| C | 0 | 149 | 0 |
| D | 0 | 150 | 0 |
| Mode M0 | |||
|---|---|---|---|
| Quadrant | BADHDUFLAG | Total packets | Discarded packets |
| A | 0 | 196668 | 0 |
| B | 0 | 202019 | 0 |
| C | 0 | 411349 | 0 |
| D | 0 | 206406 | 0 |
| Quadrant | Total seconds | Saturated seconds | Saturation percentage |
|---|---|---|---|
| A | 93360 | 1533 | 1.642031% |
| B | 93360 | 1590 | 1.703085% |
| C | 93360 | 23754 | 25.443445% |
| D | 93360 | 1634 | 1.750214% |
Noise dominated data is calculated using 1-second bins in cleaned event files. If a bin has >2000 counts, and if more than 50% of those come from <1% of pixels, then it is considered to be noise-dominated and hence unusable.
| Quadrant | # 1 sec bins | Bins with >0 counts | Bins with >2000 counts | High rate bins dominated by noise | Noise dominated (total time) | Noise dominated (detector-on time) | Marked lightcurve |
|---|---|---|---|---|---|---|---|
| A | 107964 | 93357 | 11 | 11 | 0.01% | 0.01% |  |
| B | 107964 | 93349 | 20 | 20 | 0.02% | 0.02% | 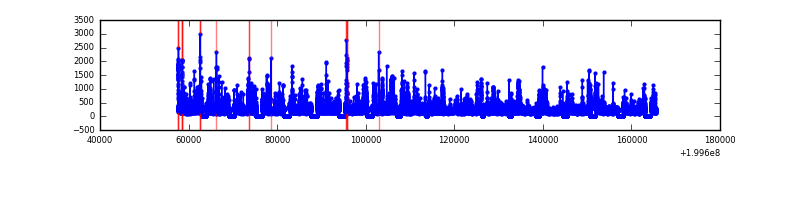 |
| C | 107964 | 93195 | 5677 | 5677 | 5.26% | 6.09% |  |
| D | 107964 | 93355 | 109 | 109 | 0.10% | 0.12% |  |
Top three noisy pixels from each quadrant. If the there are fewer than three noisy pixels in the level2.evt file, extra rows are filled as -1
| Pixel properties | Quadrant properties | ||||||
|---|---|---|---|---|---|---|---|
| Quadrant | DetID | PixID | Counts | Sigma | Mean | Median | Sigma |
| A | 14 | 249 | 796278 | 765.55 | 4674 | 4599 | 1034.1 |
| A | 0 | 118 | 240788 | 228.39 | 4674 | 4599 | 1034.1 |
| A | 8 | 15 | 91921 | 84.44 | 4674 | 4599 | 1034.1 |
| B | 4 | 80 | 1015222 | 1102.73 | 4733 | 4618 | 916.5 |
| B | 4 | 81 | 335187 | 360.7 | 4733 | 4618 | 916.5 |
| B | 2 | 249 | 287453 | 308.62 | 4733 | 4618 | 916.5 |
| C | 12 | 206 | 52474177 | 59137.33 | 3927 | 3884 | 887.3 |
| C | 1 | 192 | 4547364 | 5120.79 | 3927 | 3884 | 887.3 |
| C | 14 | 223 | 1037556 | 1165.01 | 3927 | 3884 | 887.3 |
| D | 13 | 223 | 1461872 | 1331.16 | 4591 | 4424 | 1094.9 |
| D | 5 | 233 | 906424 | 823.84 | 4591 | 4424 | 1094.9 |
| D | 13 | 120 | 737272 | 669.34 | 4591 | 4424 | 1094.9 |
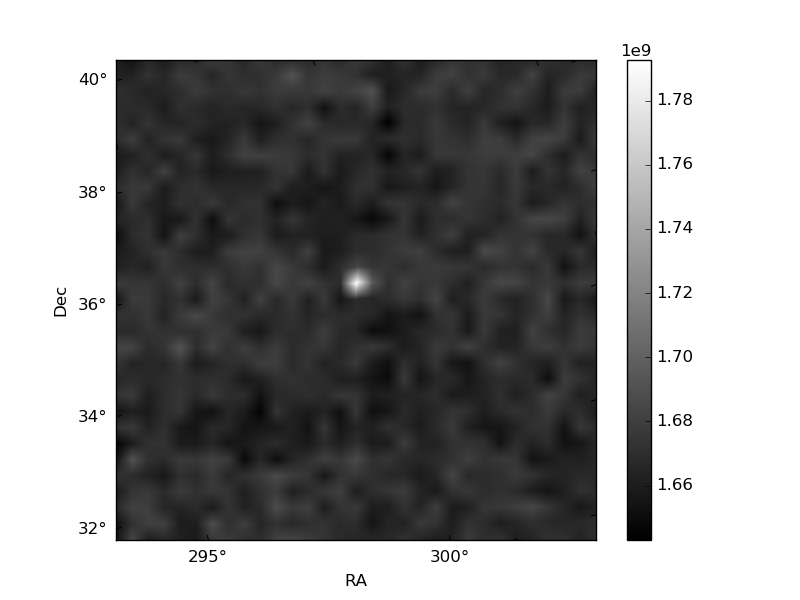
Histogram calculated using DETX and DETY for each event in the final _common_clean file
| Quadrant A |  |
 |
Quadrant B |
|---|---|---|---|
| Quadrant D |  |
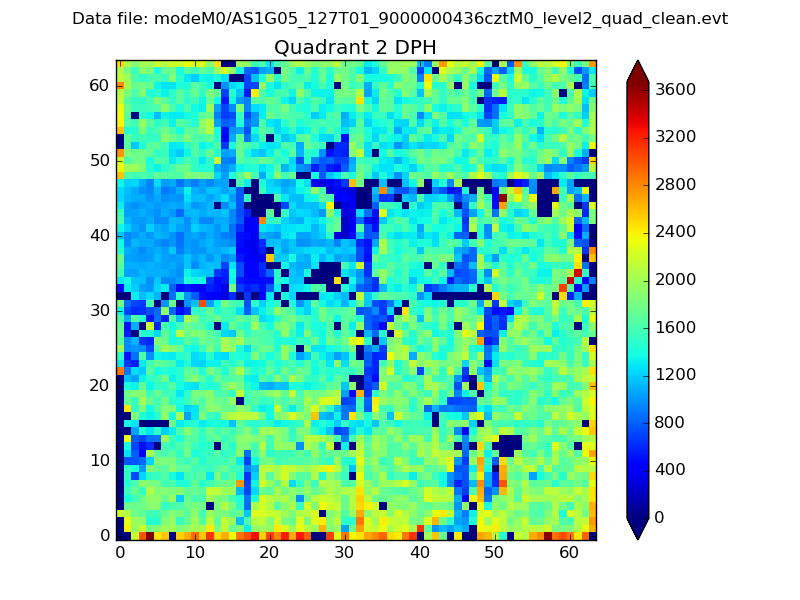 |
Quadrant C |
| Plot type | Count rate plots | Images |
|---|---|---|
| Comparison with Poisson distribution Blue bars denote a histogram of data divided into 1 sec bins. Red curve is a Poisson curve with rate = median count rate of data. |
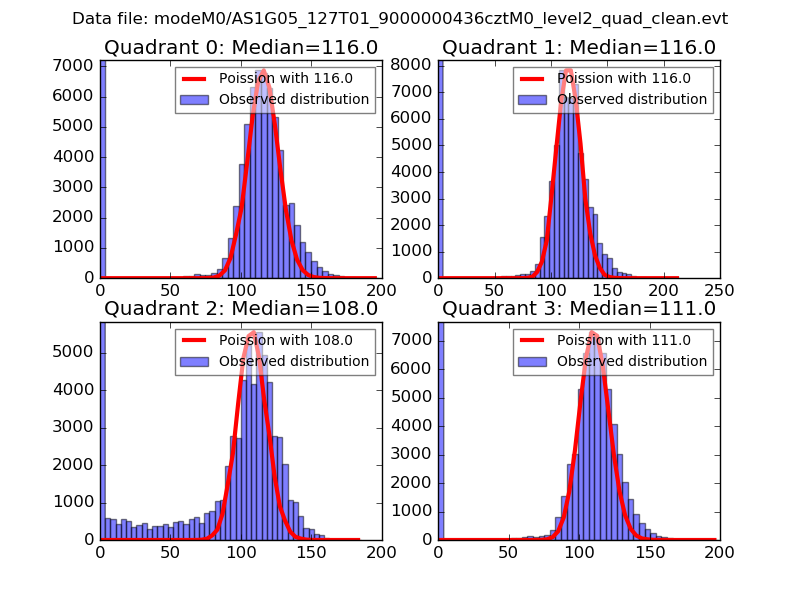 |
 |
| Quadrant-wise count rates Data is divided into 100 sec bins |
 |
|
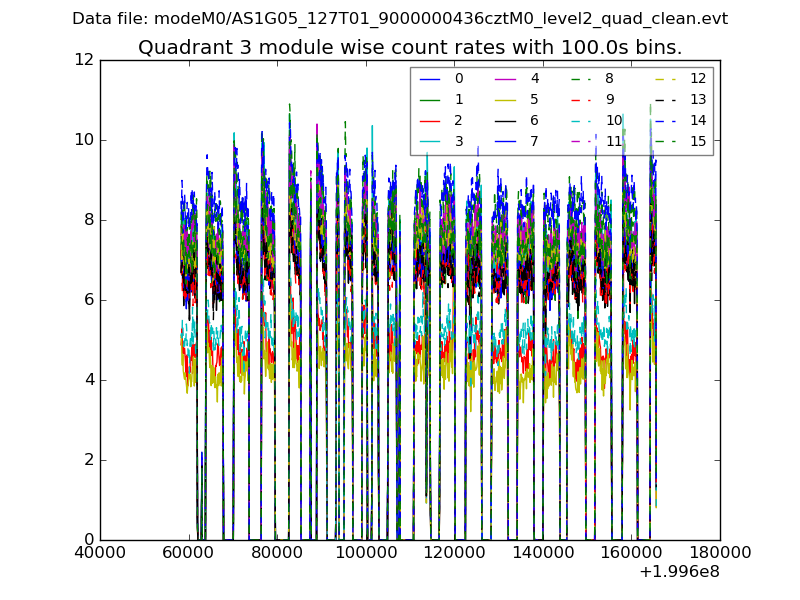
| Module-wise count rates for Quadrant A Data is divided into 100 sec bins |
 |
 |
| Module-wise count rates for Quadrant B Data is divided into 100 sec bins |
 |
 |
| Module-wise count rates for Quadrant C Data is divided into 100 sec bins |
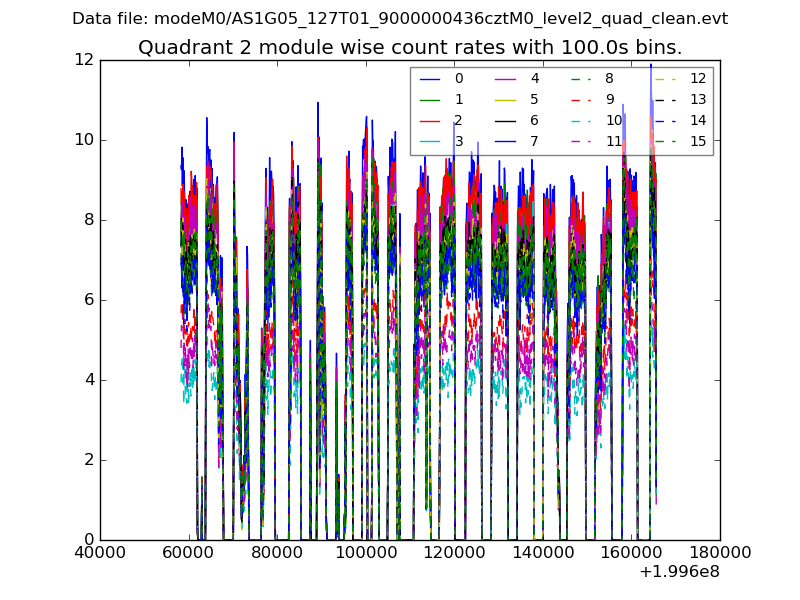 |
 |
| Module-wise count rates for Quadrant D Data is divided into 100 sec bins |
 |
 |
| Parameter | Plot |
|---|---|
| CZT HV Monitor | 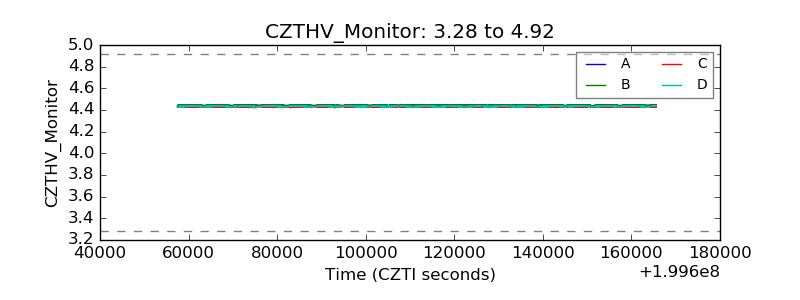 |
| D_VDD |  |
| Temperature 1 |  |
| Veto HV Monitor |  |
| Veto LLD |  |
| Alpha Counter |  |
| _CPM_Rate |  |
| CZT Counter |  |
| +2.5 Volts monitor |  |
| +5 Volts monitor |  |
| _ROLL_ROT |  |
| _Roll_DEC |  |
| _Roll_RA |  |
| Veto Counter |  |