| Param | Original file | Final file |
|---|---|---|
| Filename | modeM0/AS1G05_218T02_9000000434cztM0_level2_bc.evt | modeM0/AS1G05_218T02_9000000434cztM0_level2_quad_clean.evt |
| Size (bytes) | 4,476,672,000 | 1,692,768,960 |
| Size | 4.2 GB | 1.6 GB |
| Events in quadrant A | 28,625,002 | 10,860,072 |
| Events in quadrant B | 27,657,719 | 11,054,031 |
| Events in quadrant C | 37,026,507 | 10,481,498 |
| Events in quadrant D | 33,812,413 | 10,372,368 |
| Mode M0 | |||
|---|---|---|---|
| Quadrant | BADHDUFLAG | Total packets | Discarded packets |
| A | 0 | 273333 | 0 |
| B | 0 | 267894 | 0 |
| C | 0 | 308095 | 0 |
| D | 0 | 291375 | 0 |
| Mode M9 | |||
|---|---|---|---|
| Quadrant | BADHDUFLAG | Total packets | Discarded packets |
| A | 0 | 171 | 0 |
| B | 0 | 171 | 0 |
| C | 0 | 171 | 0 |
| D | 0 | 171 | 0 |
| Mode SS | |||
|---|---|---|---|
| Quadrant | BADHDUFLAG | Total packets | Discarded packets |
| A | 0 | 2516 | 0 |
| B | 0 | 2516 | 0 |
| C | 0 | 2516 | 0 |
| D | 0 | 2516 | 0 |
| Quadrant | Total seconds | Saturated seconds | Saturation percentage |
|---|---|---|---|
| A | 124106 | 3088 | 2.488196% |
| B | 124106 | 2197 | 1.770261% |
| C | 124106 | 6428 | 5.179443% |
| D | 124106 | 3888 | 3.132806% |
Noise dominated data is calculated using 1-second bins in cleaned event files. If a bin has >2000 counts, and if more than 50% of those come from <1% of pixels, then it is considered to be noise-dominated and hence unusable.
| Quadrant | # 1 sec bins | Bins with >0 counts | Bins with >2000 counts | High rate bins dominated by noise | Noise dominated (total time) | Noise dominated (detector-on time) | Marked lightcurve |
|---|---|---|---|---|---|---|---|
| A | 140952 | 124102 | 150 | 150 | 0.11% | 0.12% |  |
| B | 140952 | 124104 | 57 | 57 | 0.04% | 0.05% |  |
| C | 140951 | 124046 | 1171 | 1171 | 0.83% | 0.94% |  |
| D | 140952 | 124107 | 286 | 286 | 0.20% | 0.23% |  |
Top three noisy pixels from each quadrant. If the there are fewer than three noisy pixels in the level2.evt file, extra rows are filled as -1
| Pixel properties | Quadrant properties | ||||||
|---|---|---|---|---|---|---|---|
| Quadrant | DetID | PixID | Counts | Sigma | Mean | Median | Sigma |
| A | 14 | 249 | 2819926 | 2158.12 | 5881 | 5750 | 1304.0 |
| A | 12 | 247 | 974914 | 743.23 | 5881 | 5750 | 1304.0 |
| A | 0 | 149 | 820295 | 624.65 | 5881 | 5750 | 1304.0 |
| B | 4 | 80 | 833757 | 709.58 | 6003 | 5830 | 1166.8 |
| B | 4 | 81 | 832981 | 708.92 | 6003 | 5830 | 1166.8 |
| B | 2 | 249 | 725782 | 617.04 | 6003 | 5830 | 1166.8 |
| C | 1 | 192 | 6167674 | 4856.04 | 5649 | 5552 | 1269.0 |
| C | 14 | 223 | 5529831 | 4353.39 | 5649 | 5552 | 1269.0 |
| C | 12 | 206 | 1265587 | 992.97 | 5649 | 5552 | 1269.0 |
| D | 5 | 233 | 2988959 | 2210.4 | 5777 | 5556 | 1349.7 |
| D | 2 | 136 | 2777694 | 2053.87 | 5777 | 5556 | 1349.7 |
| D | 13 | 223 | 1168258 | 861.44 | 5777 | 5556 | 1349.7 |
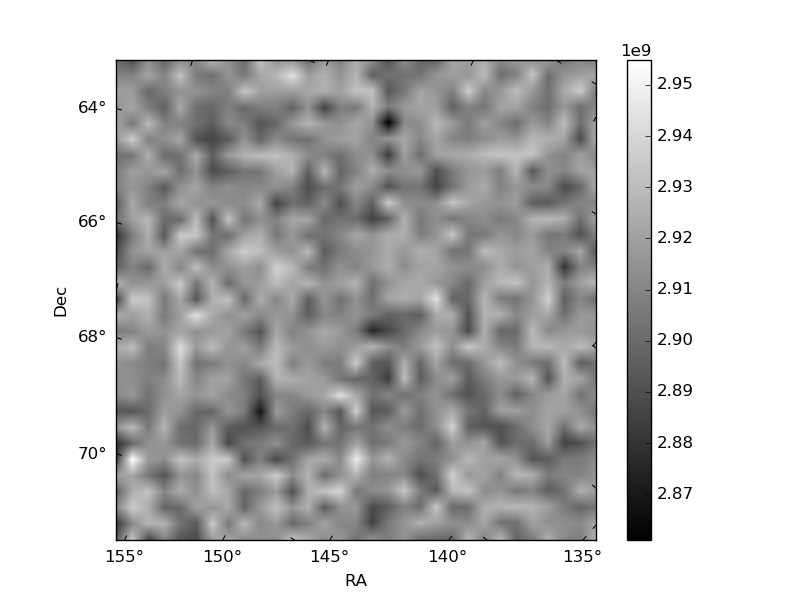
Histogram calculated using DETX and DETY for each event in the final _common_clean file
| Quadrant A |  |
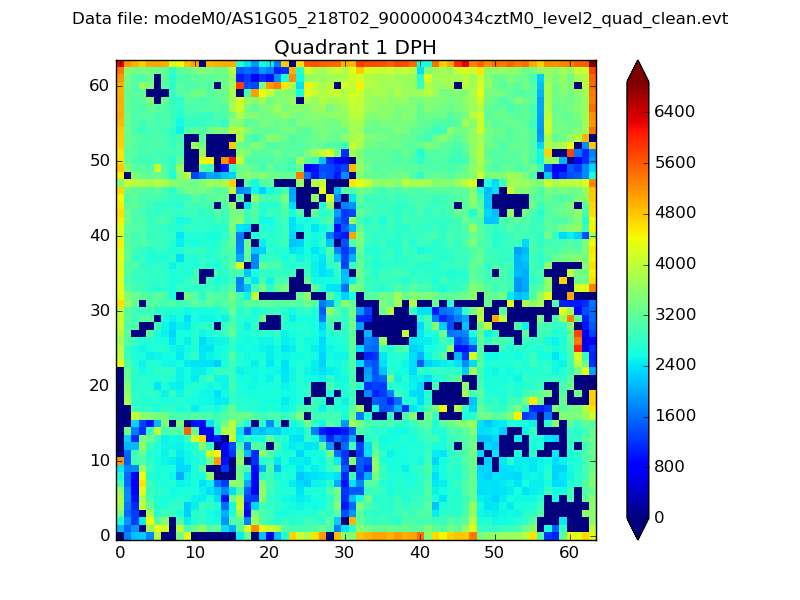 |
Quadrant B |
|---|---|---|---|
| Quadrant D | 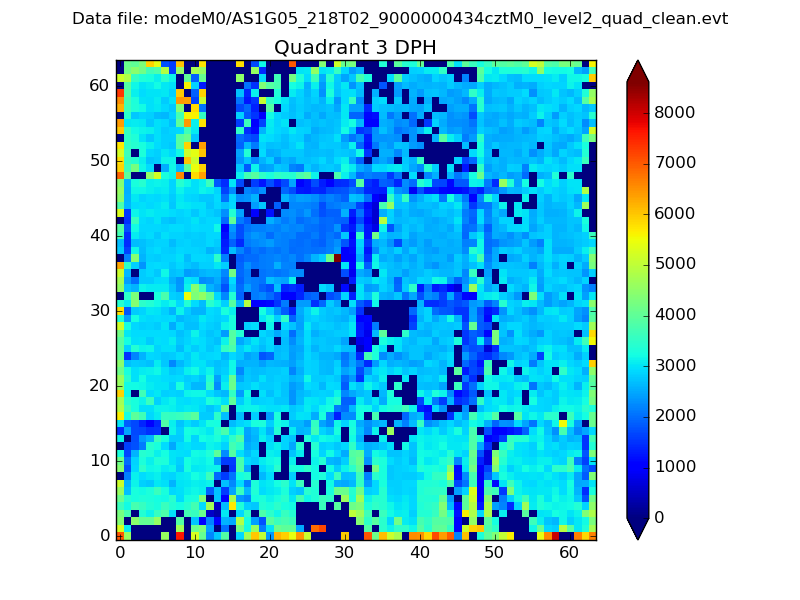 |
 |
Quadrant C |
| Plot type | Count rate plots | Images |
|---|---|---|
| Comparison with Poisson distribution Blue bars denote a histogram of data divided into 1 sec bins. Red curve is a Poisson curve with rate = median count rate of data. |
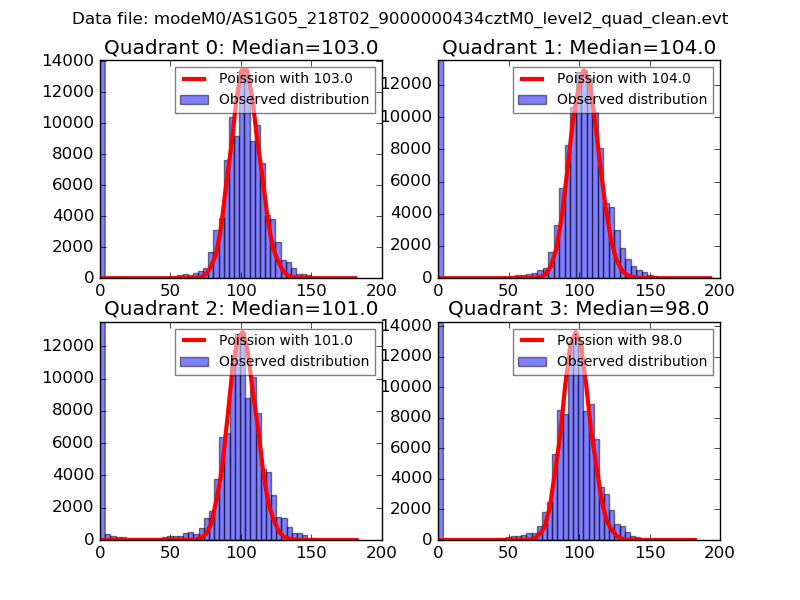 |
 |
| Quadrant-wise count rates Data is divided into 100 sec bins |
 |
|
| Module-wise count rates for Quadrant A Data is divided into 100 sec bins |
 |
 |
| Module-wise count rates for Quadrant B Data is divided into 100 sec bins |
 |
 |
| Module-wise count rates for Quadrant C Data is divided into 100 sec bins |
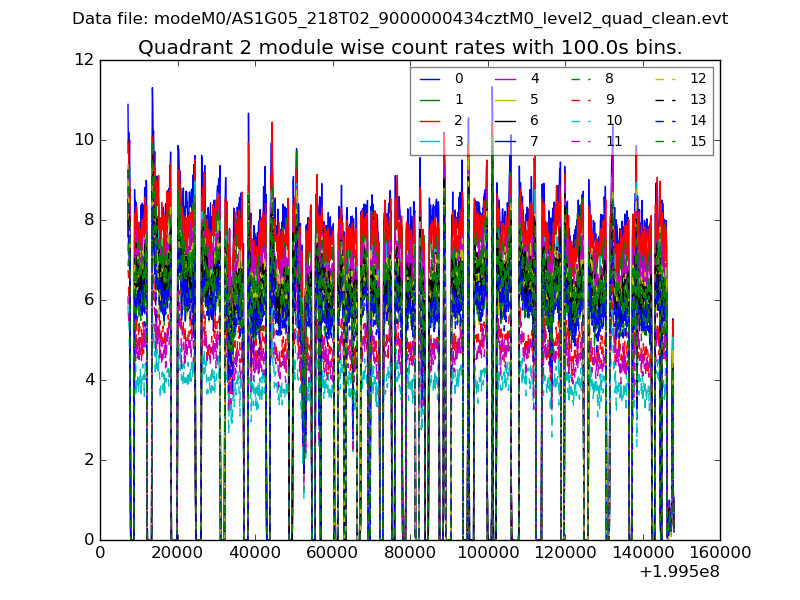 |
 |
| Module-wise count rates for Quadrant D Data is divided into 100 sec bins |
 |
 |
| Parameter | Plot |
|---|---|
| CZT HV Monitor |  |
| D_VDD | 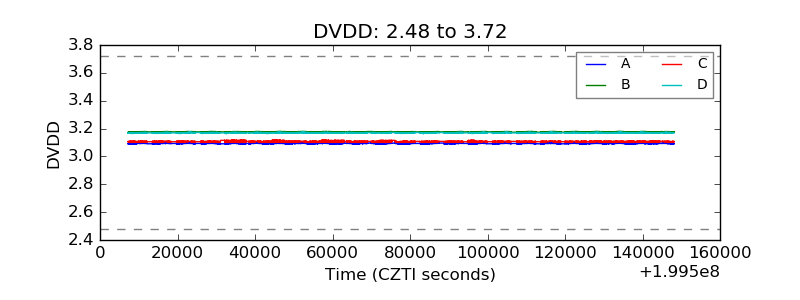 |
| Temperature 1 |  |
| Veto HV Monitor |  |
| Veto LLD |  |
| Alpha Counter |  |
| _CPM_Rate |  |
| CZT Counter |  |
| +2.5 Volts monitor |  |
| +5 Volts monitor |  |
| _ROLL_ROT | 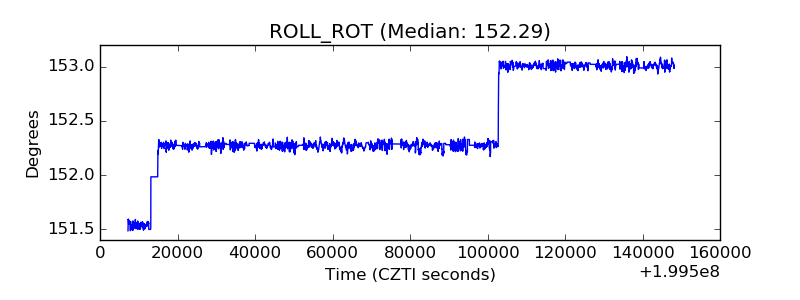 |
| _Roll_DEC |  |
| _Roll_RA | 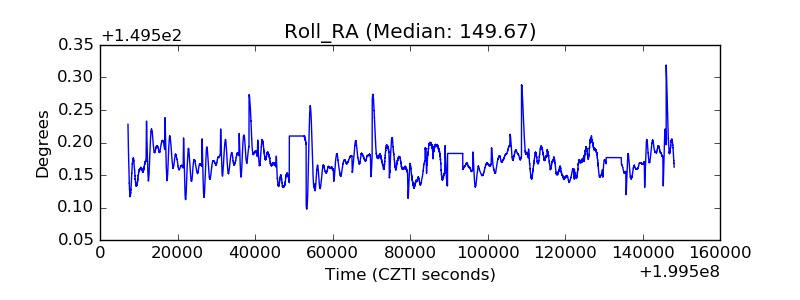 |
| Veto Counter |  |