| Param | Original file | Final file |
|---|---|---|
| Filename | modeM0/AS1G05_167T02_9000000432cztM0_level2.evt | modeM0/AS1G05_167T02_9000000432cztM0_level2_quad_clean.evt |
| Size (bytes) | 1,840,515,840 | 302,034,240 |
| Size | 1.7 GB | 288.0 MB |
| Events in quadrant A | 11,391,168 | 1,903,487 |
| Events in quadrant B | 12,467,826 | 1,899,696 |
| Events in quadrant C | 14,848,781 | 1,873,459 |
| Events in quadrant D | 15,377,785 | 1,784,734 |
| Mode M9 | |||
|---|---|---|---|
| Quadrant | BADHDUFLAG | Total packets | Discarded packets |
| A | 0 | 38 | 0 |
| B | 0 | 38 | 0 |
| C | 0 | 38 | 0 |
| D | 0 | 38 | 0 |
| Mode M0 | |||
|---|---|---|---|
| Quadrant | BADHDUFLAG | Total packets | Discarded packets |
| A | 0 | 51098 | 0 |
| B | 0 | 53583 | 0 |
| C | 0 | 60827 | 0 |
| D | 0 | 63011 | 0 |
| Mode SS | |||
|---|---|---|---|
| Quadrant | BADHDUFLAG | Total packets | Discarded packets |
| A | 0 | 500 | 0 |
| B | 0 | 500 | 0 |
| C | 0 | 500 | 0 |
| D | 0 | 500 | 0 |
| Quadrant | Total seconds | Saturated seconds | Saturation percentage |
|---|---|---|---|
| A | 24515 | 188 | 0.766877% |
| B | 24515 | 386 | 1.574546% |
| C | 24515 | 849 | 3.463186% |
| D | 24515 | 852 | 3.475423% |
Noise dominated data is calculated using 1-second bins in cleaned event files. If a bin has >2000 counts, and if more than 50% of those come from <1% of pixels, then it is considered to be noise-dominated and hence unusable.
| Quadrant | # 1 sec bins | Bins with >0 counts | Bins with >2000 counts | High rate bins dominated by noise | Noise dominated (total time) | Noise dominated (detector-on time) | Marked lightcurve |
|---|---|---|---|---|---|---|---|
| A | 28285 | 24519 | 17 | 17 | 0.06% | 0.07% | 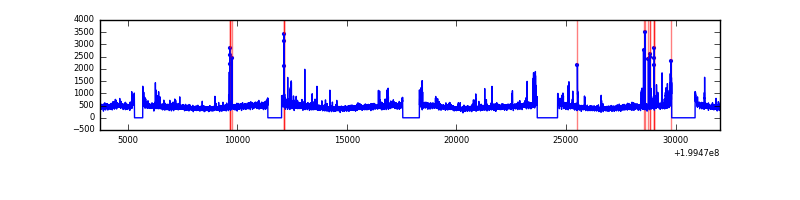 |
| B | 28285 | 24520 | 151 | 151 | 0.53% | 0.62% |  |
| C | 28285 | 24519 | 608 | 608 | 2.15% | 2.48% |  |
| D | 28285 | 24520 | 658 | 658 | 2.33% | 2.68% |  |
Top three noisy pixels from each quadrant. If the there are fewer than three noisy pixels in the level2.evt file, extra rows are filled as -1
| Pixel properties | Quadrant properties | ||||||
|---|---|---|---|---|---|---|---|
| Quadrant | DetID | PixID | Counts | Sigma | Mean | Median | Sigma |
| A | 14 | 249 | 271040 | 461.89 | 2827 | 2766 | 580.8 |
| A | 3 | 1 | 120350 | 202.44 | 2827 | 2766 | 580.8 |
| A | 12 | 247 | 58135 | 95.33 | 2827 | 2766 | 580.8 |
| B | 4 | 81 | 496784 | 895.28 | 2860 | 2797 | 551.8 |
| B | 5 | 70 | 476571 | 858.65 | 2860 | 2797 | 551.8 |
| B | 3 | 0 | 170147 | 303.3 | 2860 | 2797 | 551.8 |
| C | 14 | 223 | 3215684 | 5093.0 | 2711 | 2728 | 630.9 |
| C | 1 | 192 | 628345 | 991.69 | 2711 | 2728 | 630.9 |
| C | 6 | 80 | 118458 | 183.45 | 2711 | 2728 | 630.9 |
| D | 12 | 233 | 2530782 | 3885.76 | 2692 | 2611 | 650.6 |
| D | 2 | 136 | 599321 | 917.13 | 2692 | 2611 | 650.6 |
| D | 5 | 233 | 542111 | 829.2 | 2692 | 2611 | 650.6 |
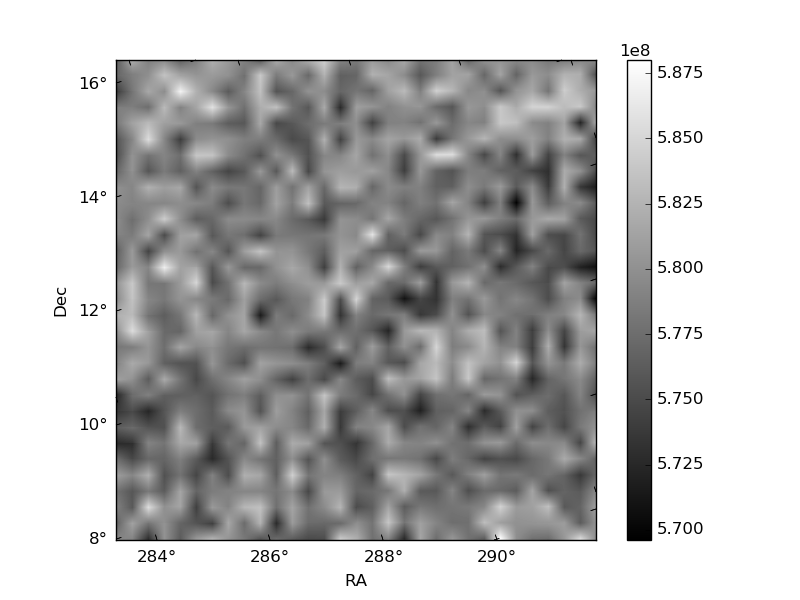
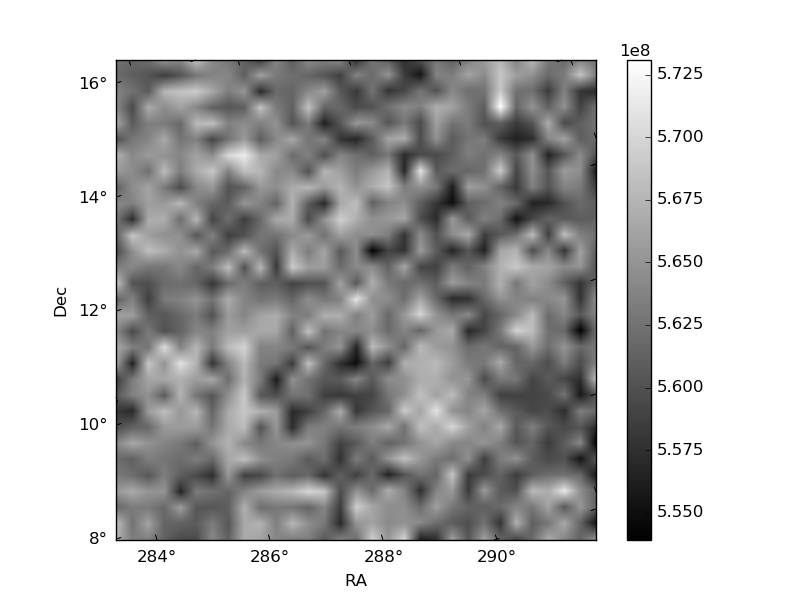
Histogram calculated using DETX and DETY for each event in the final _common_clean file
| Quadrant A |  |
 |
Quadrant B |
|---|---|---|---|
| Quadrant D | 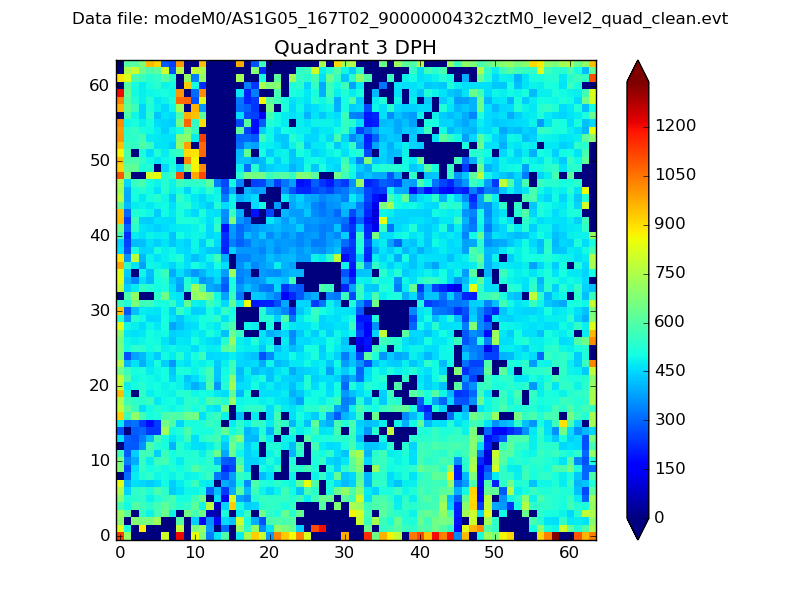 |
 |
Quadrant C |
| Plot type | Count rate plots | Images |
|---|---|---|
| Comparison with Poisson distribution Blue bars denote a histogram of data divided into 1 sec bins. Red curve is a Poisson curve with rate = median count rate of data. |
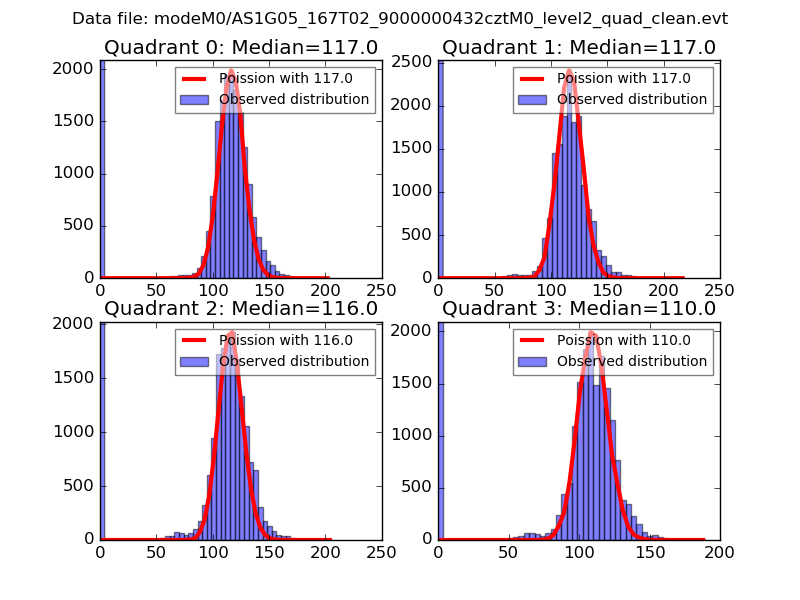 |
 |
| Quadrant-wise count rates Data is divided into 100 sec bins |
 |
|
| Module-wise count rates for Quadrant A Data is divided into 100 sec bins |
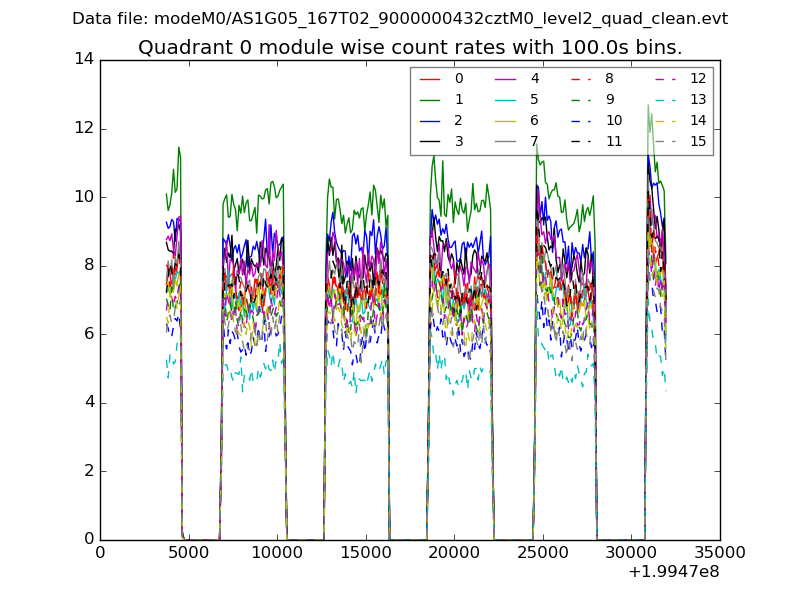 |
 |
| Module-wise count rates for Quadrant B Data is divided into 100 sec bins |
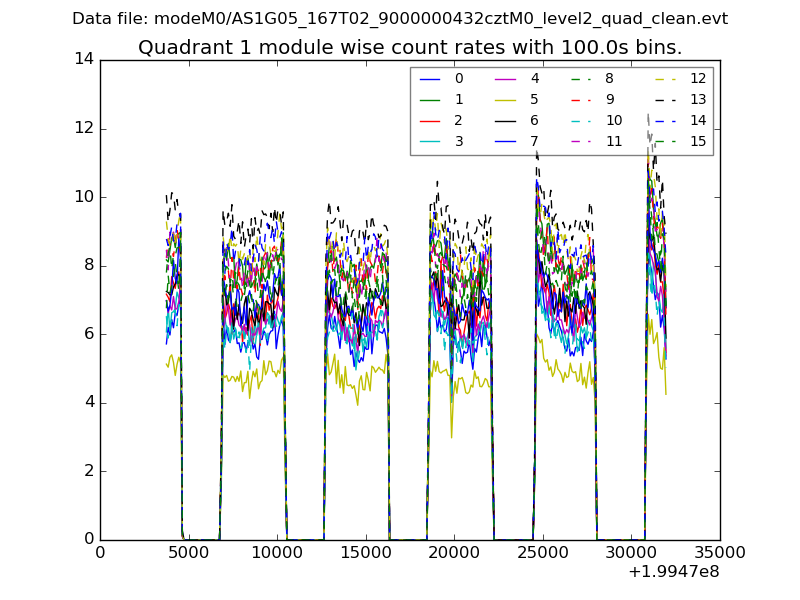 |
 |
| Module-wise count rates for Quadrant C Data is divided into 100 sec bins |
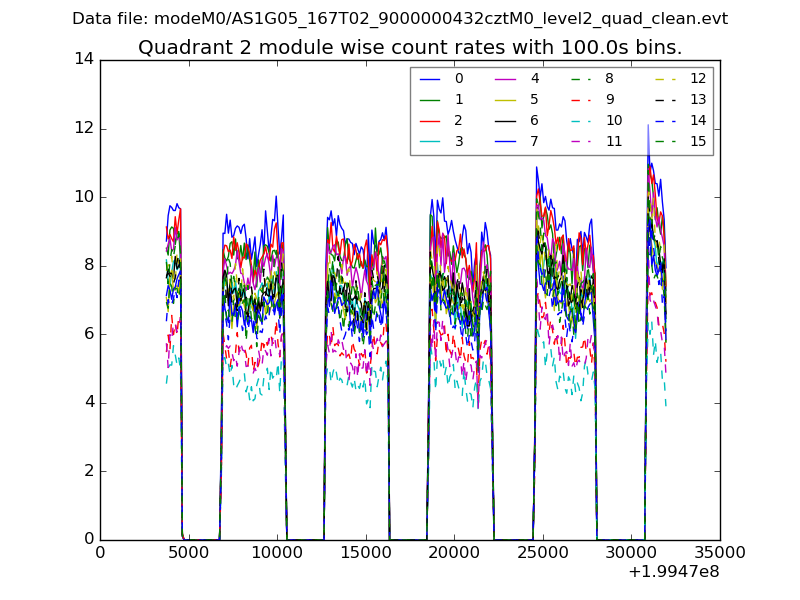 |
 |
| Module-wise count rates for Quadrant D Data is divided into 100 sec bins |
 |
 |
| Parameter | Plot |
|---|---|
| CZT HV Monitor |  |
| D_VDD |  |
| Temperature 1 |  |
| Veto HV Monitor |  |
| Veto LLD |  |
| Alpha Counter |  |
| _CPM_Rate |  |
| CZT Counter |  |
| +2.5 Volts monitor |  |
| +5 Volts monitor |  |
| _ROLL_ROT |  |
| _Roll_DEC |  |
| _Roll_RA |  |
| Veto Counter | 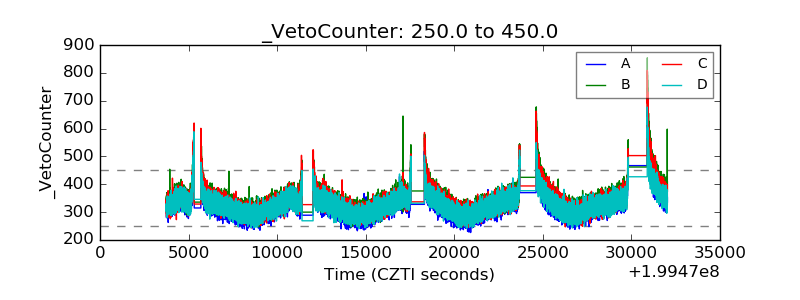 |