| Param | Original file | Final file |
|---|---|---|
| Filename | modeM0/AS1G05_237T03_9000000426cztM0_level2.evt | modeM0/AS1G05_237T03_9000000426cztM0_level2_quad_clean.evt |
| Size (bytes) | 13,044,113,280 | 2,159,856,000 |
| Size | 12.1 GB | 2.0 GB |
| Events in quadrant A | 86,602,884 | 13,728,233 |
| Events in quadrant B | 100,188,139 | 13,337,769 |
| Events in quadrant C | 99,159,297 | 13,595,101 |
| Events in quadrant D | 97,660,685 | 13,134,490 |
| Mode M9 | |||
|---|---|---|---|
| Quadrant | BADHDUFLAG | Total packets | Discarded packets |
| A | 0 | 343 | 0 |
| B | 0 | 343 | 0 |
| C | 0 | 343 | 0 |
| D | 0 | 343 | 0 |
| Mode SS | |||
|---|---|---|---|
| Quadrant | BADHDUFLAG | Total packets | Discarded packets |
| A | 0 | 3460 | 0 |
| B | 0 | 3460 | 0 |
| C | 0 | 3460 | 0 |
| D | 0 | 3460 | 0 |
| Mode M0 | |||
|---|---|---|---|
| Quadrant | BADHDUFLAG | Total packets | Discarded packets |
| A | 0 | 370374 | 0 |
| B | 0 | 410355 | 0 |
| C | 0 | 412805 | 0 |
| D | 0 | 412100 | 0 |
| Quadrant | Total seconds | Saturated seconds | Saturation percentage |
|---|---|---|---|
| A | 169679 | 3018 | 1.778653% |
| B | 169655 | 8632 | 5.087973% |
| C | 169650 | 5851 | 3.448865% |
| D | 169671 | 5525 | 3.256302% |
Noise dominated data is calculated using 1-second bins in cleaned event files. If a bin has >2000 counts, and if more than 50% of those come from <1% of pixels, then it is considered to be noise-dominated and hence unusable.
| Quadrant | # 1 sec bins | Bins with >0 counts | Bins with >2000 counts | High rate bins dominated by noise | Noise dominated (total time) | Noise dominated (detector-on time) | Marked lightcurve |
|---|---|---|---|---|---|---|---|
| A | 204459 | 169764 | 1085 | 1085 | 0.53% | 0.64% |  |
| B | 204459 | 169757 | 2200 | 2200 | 1.08% | 1.30% |  |
| C | 204459 | 169739 | 3527 | 3527 | 1.73% | 2.08% |  |
| D | 204459 | 169778 | 3406 | 3406 | 1.67% | 2.01% | 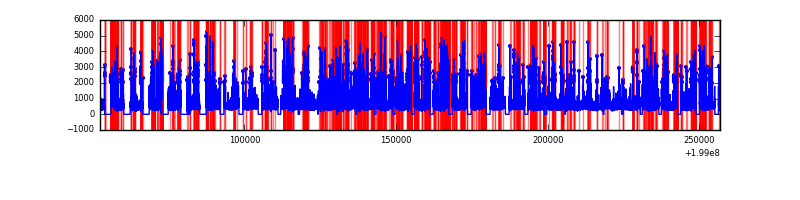 |
Top three noisy pixels from each quadrant. If the there are fewer than three noisy pixels in the level2.evt file, extra rows are filled as -1
| Pixel properties | Quadrant properties | ||||||
|---|---|---|---|---|---|---|---|
| Quadrant | DetID | PixID | Counts | Sigma | Mean | Median | Sigma |
| A | 8 | 15 | 3394071 | 857.71 | 19564 | 19173 | 3934.8 |
| A | 14 | 249 | 2996144 | 756.58 | 19564 | 19173 | 3934.8 |
| A | 0 | 50 | 1681719 | 422.53 | 19564 | 19173 | 3934.8 |
| B | 4 | 81 | 11151586 | 3055.77 | 19242 | 18847 | 3643.2 |
| B | 15 | 204 | 4523204 | 1236.38 | 19242 | 18847 | 3643.2 |
| B | 0 | 219 | 2306772 | 628.0 | 19242 | 18847 | 3643.2 |
| C | 14 | 223 | 9428323 | 2172.82 | 18760 | 18926 | 4330.5 |
| C | 1 | 192 | 6224395 | 1432.97 | 18760 | 18926 | 4330.5 |
| C | 0 | 219 | 3672927 | 843.78 | 18760 | 18926 | 4330.5 |
| D | 1 | 7 | 6902398 | 1385.31 | 18642 | 18253 | 4969.4 |
| D | 13 | 114 | 3266045 | 653.56 | 18642 | 18253 | 4969.4 |
| D | 2 | 136 | 1993605 | 397.51 | 18642 | 18253 | 4969.4 |
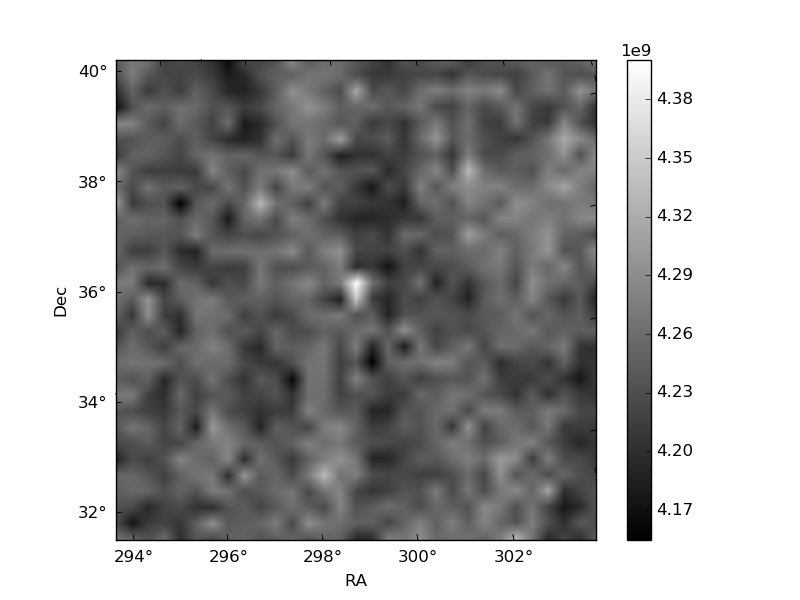
Histogram calculated using DETX and DETY for each event in the final _common_clean file
| Quadrant A | 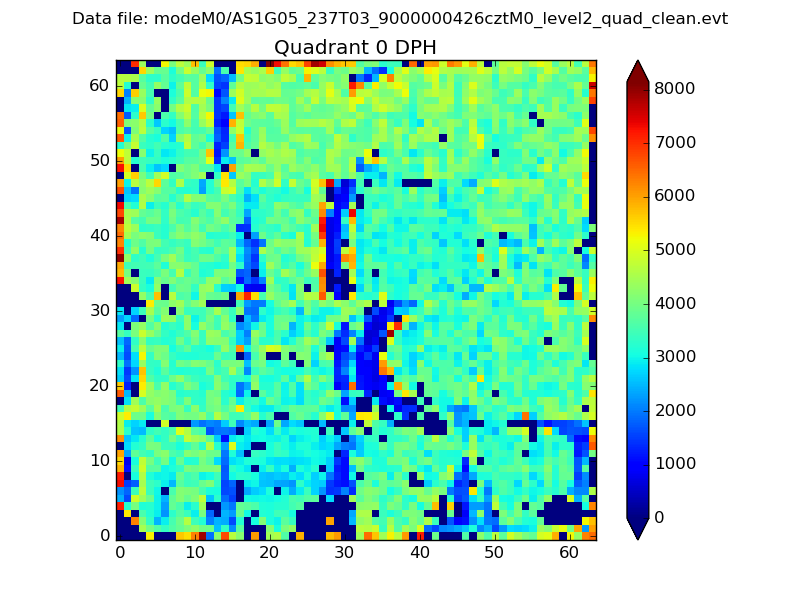 |
 |
Quadrant B |
|---|---|---|---|
| Quadrant D |  |
 |
Quadrant C |
| Plot type | Count rate plots | Images |
|---|---|---|
| Comparison with Poisson distribution Blue bars denote a histogram of data divided into 1 sec bins. Red curve is a Poisson curve with rate = median count rate of data. |
 |
 |
| Quadrant-wise count rates Data is divided into 100 sec bins |
 |
|
| Module-wise count rates for Quadrant A Data is divided into 100 sec bins |
 |
 |
| Module-wise count rates for Quadrant B Data is divided into 100 sec bins |
 |
 |
| Module-wise count rates for Quadrant C Data is divided into 100 sec bins |
 |
 |
| Module-wise count rates for Quadrant D Data is divided into 100 sec bins |
 |
 |
| Parameter | Plot |
|---|---|
| CZT HV Monitor |  |
| D_VDD |  |
| Temperature 1 |  |
| Veto HV Monitor | 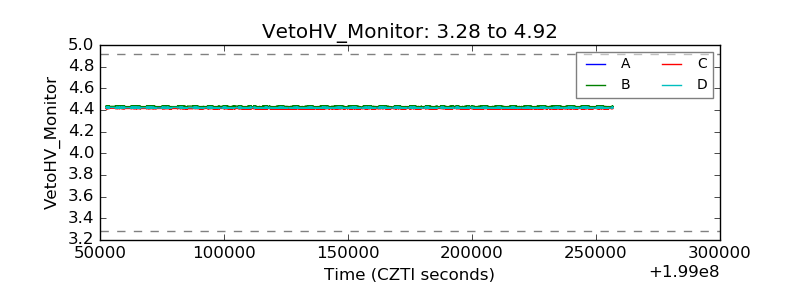 |
| Veto LLD | 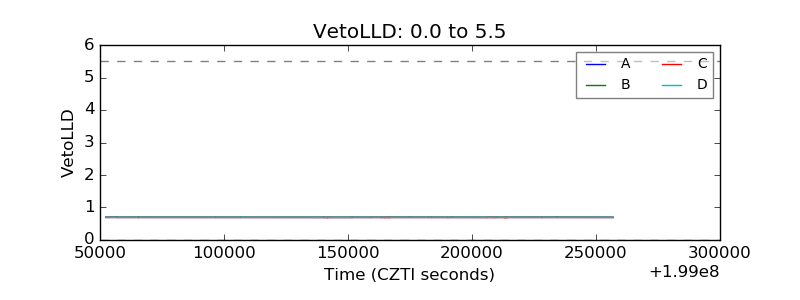 |
| Alpha Counter |  |
| _CPM_Rate |  |
| CZT Counter |  |
| +2.5 Volts monitor | 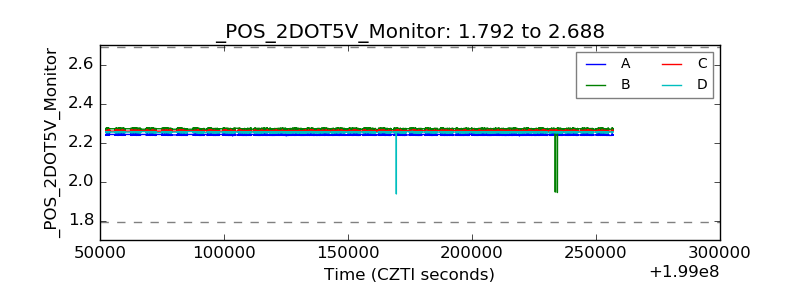 |
| +5 Volts monitor |  |
| _ROLL_ROT |  |
| _Roll_DEC |  |
| _Roll_RA |  |
| Veto Counter |  |