| Param | Original file | Final file |
|---|---|---|
| Filename | modeM0/AS1G05_238T03_9000000424cztM0_level2_bc.evt | modeM0/AS1G05_238T03_9000000424cztM0_level2_quad_clean.evt |
| Size (bytes) | 3,582,800,640 | 1,083,372,480 |
| Size | 3.3 GB | 1.0 GB |
| Events in quadrant A | 20,275,915 | 6,737,608 |
| Events in quadrant B | 30,098,053 | 6,578,483 |
| Events in quadrant C | 20,912,340 | 6,549,124 |
| Events in quadrant D | 30,651,095 | 6,334,988 |
| Mode M0 | |||
|---|---|---|---|
| Quadrant | BADHDUFLAG | Total packets | Discarded packets |
| A | 0 | 198450 | 0 |
| B | 0 | 231275 | 0 |
| C | 0 | 202190 | 0 |
| D | 0 | 231624 | 0 |
| Mode M9 | |||
|---|---|---|---|
| Quadrant | BADHDUFLAG | Total packets | Discarded packets |
| A | 0 | 512 | 0 |
| B | 0 | 512 | 0 |
| C | 0 | 512 | 0 |
| D | 0 | 512 | 0 |
| Mode SS | |||
|---|---|---|---|
| Quadrant | BADHDUFLAG | Total packets | Discarded packets |
| A | 0 | 1976 | 0 |
| B | 0 | 1976 | 0 |
| C | 0 | 1976 | 0 |
| D | 0 | 1976 | 0 |
| Quadrant | Total seconds | Saturated seconds | Saturation percentage |
|---|---|---|---|
| A | 96484 | 195 | 0.202106% |
| B | 96484 | 1943 | 2.013805% |
| C | 96484 | 482 | 0.499565% |
| D | 96484 | 1742 | 1.805481% |
Noise dominated data is calculated using 1-second bins in cleaned event files. If a bin has >2000 counts, and if more than 50% of those come from <1% of pixels, then it is considered to be noise-dominated and hence unusable.
| Quadrant | # 1 sec bins | Bins with >0 counts | Bins with >2000 counts | High rate bins dominated by noise | Noise dominated (total time) | Noise dominated (detector-on time) | Marked lightcurve |
|---|---|---|---|---|---|---|---|
| A | 145845 | 96484 | 18 | 18 | 0.01% | 0.02% | 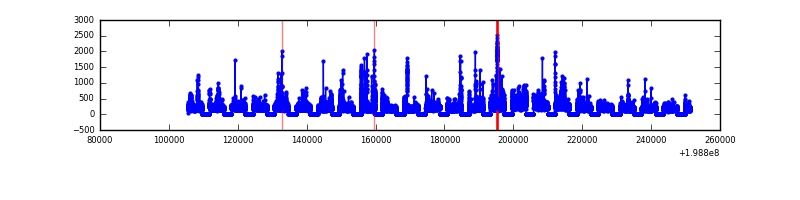 |
| B | 145845 | 96483 | 228 | 228 | 0.16% | 0.24% | 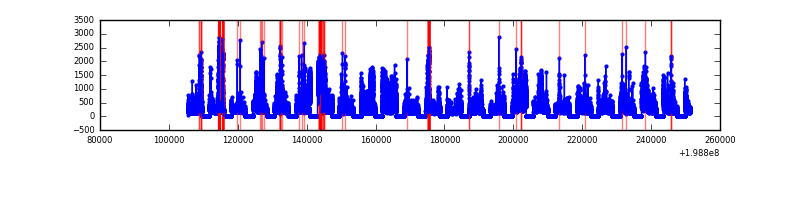 |
| C | 145845 | 96482 | 80 | 80 | 0.05% | 0.08% |  |
| D | 145845 | 96484 | 680 | 680 | 0.47% | 0.70% |  |
Top three noisy pixels from each quadrant. If the there are fewer than three noisy pixels in the level2.evt file, extra rows are filled as -1
| Pixel properties | Quadrant properties | ||||||
|---|---|---|---|---|---|---|---|
| Quadrant | DetID | PixID | Counts | Sigma | Mean | Median | Sigma |
| A | 8 | 15 | 1026888 | 1038.8 | 4526 | 4426 | 984.3 |
| A | 14 | 238 | 335316 | 336.18 | 4526 | 4426 | 984.3 |
| A | 0 | 50 | 264521 | 264.25 | 4526 | 4426 | 984.3 |
| B | 15 | 204 | 8958121 | 10452.36 | 4509 | 4385 | 856.6 |
| B | 0 | 230 | 1387176 | 1614.23 | 4509 | 4385 | 856.6 |
| B | 0 | 219 | 615819 | 713.77 | 4509 | 4385 | 856.6 |
| C | 14 | 223 | 1240051 | 1248.46 | 4405 | 4336 | 989.8 |
| C | 6 | 80 | 560499 | 561.9 | 4405 | 4336 | 989.8 |
| C | 1 | 16 | 403814 | 403.6 | 4405 | 4336 | 989.8 |
| D | 13 | 114 | 6210015 | 5627.02 | 4422 | 4260 | 1102.8 |
| D | 2 | 152 | 1906258 | 1724.62 | 4422 | 4260 | 1102.8 |
| D | 7 | 80 | 1716349 | 1552.42 | 4422 | 4260 | 1102.8 |
Histogram calculated using DETX and DETY for each event in the final _common_clean file
| Quadrant A |  |
 |
Quadrant B |
|---|---|---|---|
| Quadrant D |  |
 |
Quadrant C |
| Plot type | Count rate plots | Images |
|---|---|---|
| Comparison with Poisson distribution Blue bars denote a histogram of data divided into 1 sec bins. Red curve is a Poisson curve with rate = median count rate of data. |
 |
 |
| Quadrant-wise count rates Data is divided into 100 sec bins |
 |
|
| Module-wise count rates for Quadrant A Data is divided into 100 sec bins |
 |
 |
| Module-wise count rates for Quadrant B Data is divided into 100 sec bins |
 |
 |
| Module-wise count rates for Quadrant C Data is divided into 100 sec bins |
 |
 |
| Module-wise count rates for Quadrant D Data is divided into 100 sec bins |
 |
 |
| Parameter | Plot |
|---|---|
| CZT HV Monitor |  |
| D_VDD |  |
| Temperature 1 |  |
| Veto HV Monitor |  |
| Veto LLD |  |
| Alpha Counter | 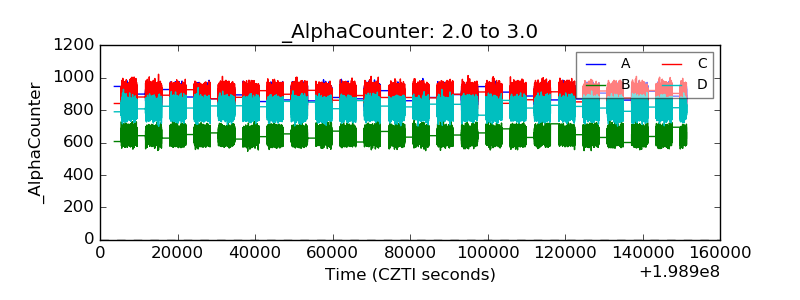 |
| _CPM_Rate |  |
| CZT Counter |  |
| +2.5 Volts monitor |  |
| +5 Volts monitor |  |
| _ROLL_ROT |  |
| _Roll_DEC |  |
| _Roll_RA |  |
| Veto Counter |  |