| Param | Original file | Final file |
|---|---|---|
| Filename | modeM0/AS1G05_237T02_9000000422cztM0_level2_bc.evt | modeM0/AS1G05_237T02_9000000422cztM0_level2_quad_clean.evt |
| Size (bytes) | 3,412,304,640 | 1,332,123,840 |
| Size | 3.2 GB | 1.2 GB |
| Events in quadrant A | 18,541,422 | 8,553,308 |
| Events in quadrant B | 30,698,433 | 8,491,415 |
| Events in quadrant C | 20,162,583 | 8,746,207 |
| Events in quadrant D | 27,917,285 | 8,495,712 |
| Mode SS | |||
|---|---|---|---|
| Quadrant | BADHDUFLAG | Total packets | Discarded packets |
| A | 0 | 1808 | 0 |
| B | 0 | 1808 | 0 |
| C | 0 | 1808 | 0 |
| D | 0 | 1808 | 0 |
| Mode M0 | |||
|---|---|---|---|
| Quadrant | BADHDUFLAG | Total packets | Discarded packets |
| A | 0 | 183981 | 0 |
| B | 0 | 223489 | 0 |
| C | 0 | 190039 | 0 |
| D | 0 | 212859 | 0 |
| Mode M9 | |||
|---|---|---|---|
| Quadrant | BADHDUFLAG | Total packets | Discarded packets |
| A | 0 | 453 | 0 |
| B | 0 | 453 | 0 |
| C | 0 | 453 | 0 |
| D | 0 | 453 | 0 |
| Quadrant | Total seconds | Saturated seconds | Saturation percentage |
|---|---|---|---|
| A | 88473 | 409 | 0.462288% |
| B | 88473 | 2863 | 3.236016% |
| C | 88473 | 829 | 0.937009% |
| D | 88473 | 2028 | 2.292225% |
Noise dominated data is calculated using 1-second bins in cleaned event files. If a bin has >2000 counts, and if more than 50% of those come from <1% of pixels, then it is considered to be noise-dominated and hence unusable.
| Quadrant | # 1 sec bins | Bins with >0 counts | Bins with >2000 counts | High rate bins dominated by noise | Noise dominated (total time) | Noise dominated (detector-on time) | Marked lightcurve |
|---|---|---|---|---|---|---|---|
| A | 133651 | 88472 | 117 | 117 | 0.09% | 0.13% |  |
| B | 133651 | 88469 | 218 | 218 | 0.16% | 0.25% |  |
| C | 133651 | 88471 | 164 | 164 | 0.12% | 0.19% |  |
| D | 133651 | 88471 | 837 | 837 | 0.63% | 0.95% |  |
Top three noisy pixels from each quadrant. If the there are fewer than three noisy pixels in the level2.evt file, extra rows are filled as -1
| Pixel properties | Quadrant properties | ||||||
|---|---|---|---|---|---|---|---|
| Quadrant | DetID | PixID | Counts | Sigma | Mean | Median | Sigma |
| A | 0 | 50 | 1444573 | 1662.74 | 3956 | 3872 | 866.5 |
| A | 14 | 249 | 957162 | 1100.21 | 3956 | 3872 | 866.5 |
| A | 12 | 247 | 308478 | 351.55 | 3956 | 3872 | 866.5 |
| B | 15 | 204 | 11021162 | 14292.76 | 3971 | 3856 | 770.8 |
| B | 0 | 230 | 1169143 | 1511.73 | 3971 | 3856 | 770.8 |
| B | 2 | 249 | 811616 | 1047.91 | 3971 | 3856 | 770.8 |
| C | 1 | 192 | 2547204 | 2845.95 | 3962 | 3904 | 893.7 |
| C | 6 | 80 | 894918 | 997.04 | 3962 | 3904 | 893.7 |
| C | 0 | 219 | 327355 | 361.94 | 3962 | 3904 | 893.7 |
| D | 13 | 114 | 5928815 | 6311.14 | 3949 | 3831 | 938.8 |
| D | 7 | 80 | 1758763 | 1869.31 | 3949 | 3831 | 938.8 |
| D | 2 | 152 | 1431037 | 1520.22 | 3949 | 3831 | 938.8 |
Histogram calculated using DETX and DETY for each event in the final _common_clean file
| Quadrant A |  |
 |
Quadrant B |
|---|---|---|---|
| Quadrant D |  |
 |
Quadrant C |
| Plot type | Count rate plots | Images |
|---|---|---|
| Comparison with Poisson distribution Blue bars denote a histogram of data divided into 1 sec bins. Red curve is a Poisson curve with rate = median count rate of data. |
 |
 |
| Quadrant-wise count rates Data is divided into 100 sec bins |
 |
|
| Module-wise count rates for Quadrant A Data is divided into 100 sec bins |
 |
 |
| Module-wise count rates for Quadrant B Data is divided into 100 sec bins |
 |
 |
| Module-wise count rates for Quadrant C Data is divided into 100 sec bins |
 |
 |
| Module-wise count rates for Quadrant D Data is divided into 100 sec bins |
 |
 |
| Parameter | Plot |
|---|---|
| CZT HV Monitor |  |
| D_VDD | 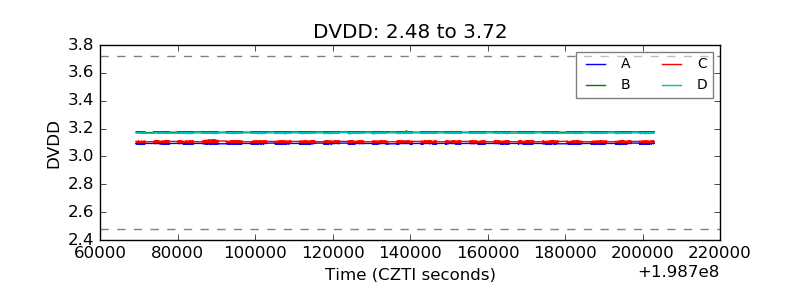 |
| Temperature 1 |  |
| Veto HV Monitor |  |
| Veto LLD |  |
| Alpha Counter |  |
| _CPM_Rate |  |
| CZT Counter |  |
| +2.5 Volts monitor | 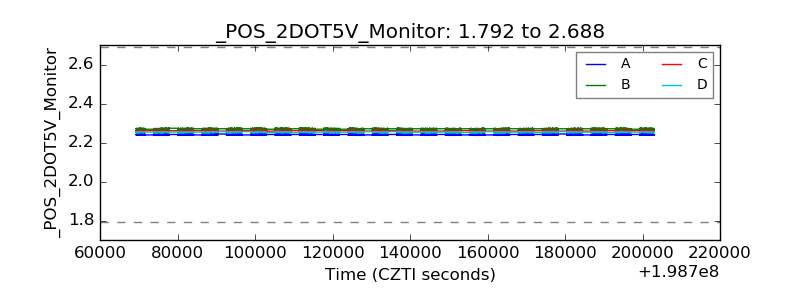 |
| +5 Volts monitor |  |
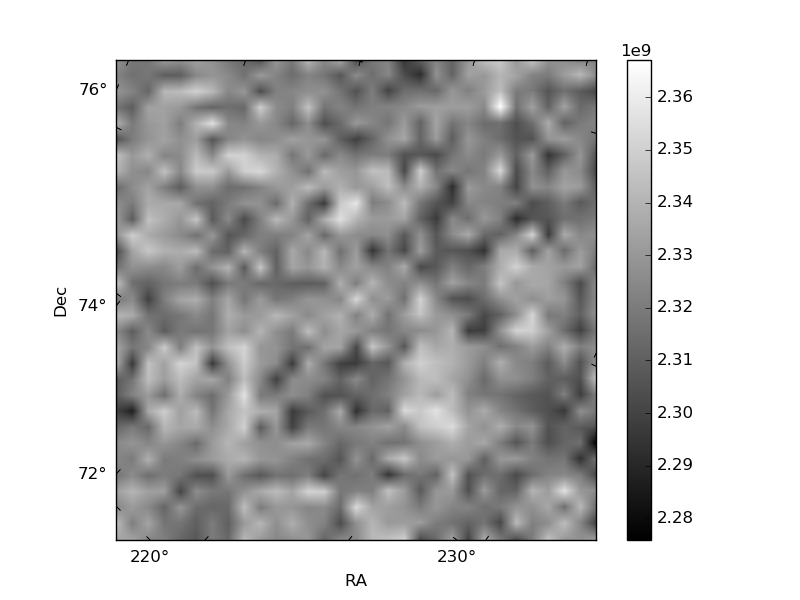
| _ROLL_ROT |  |
| _Roll_DEC |  |
| _Roll_RA |  |
| Veto Counter |  |