| Param | Original file | Final file |
|---|---|---|
| Filename | modeM0/AS1G05_238T02_9000000420cztM0_level2.evt | modeM0/AS1G05_238T02_9000000420cztM0_level2_quad_clean.evt |
| Size (bytes) | 7,488,403,200 | 1,065,340,800 |
| Size | 7.0 GB | 1016.0 MB |
| Events in quadrant A | 62,023,519 | 6,592,662 |
| Events in quadrant B | 48,301,410 | 6,727,800 |
| Events in quadrant C | 60,763,674 | 6,412,446 |
| Events in quadrant D | 49,690,679 | 6,411,949 |
| Mode M0 | |||
|---|---|---|---|
| Quadrant | BADHDUFLAG | Total packets | Discarded packets |
| A | 0 | 244151 | 0 |
| B | 0 | 203094 | 0 |
| C | 0 | 245200 | 0 |
| D | 0 | 213410 | 0 |
| Mode SS | |||
|---|---|---|---|
| Quadrant | BADHDUFLAG | Total packets | Discarded packets |
| A | 0 | 1826 | 0 |
| B | 0 | 1826 | 0 |
| C | 0 | 1826 | 0 |
| D | 0 | 1826 | 0 |
| Mode M9 | |||
|---|---|---|---|
| Quadrant | BADHDUFLAG | Total packets | Discarded packets |
| A | 0 | 459 | 0 |
| B | 0 | 459 | 0 |
| C | 0 | 459 | 0 |
| D | 0 | 459 | 0 |
| Quadrant | Total seconds | Saturated seconds | Saturation percentage |
|---|---|---|---|
| A | 89266 | 4954 | 5.549705% |
| B | 89309 | 614 | 0.687501% |
| C | 89309 | 6186 | 6.926514% |
| D | 89309 | 1573 | 1.761301% |
Noise dominated data is calculated using 1-second bins in cleaned event files. If a bin has >2000 counts, and if more than 50% of those come from <1% of pixels, then it is considered to be noise-dominated and hence unusable.
| Quadrant | # 1 sec bins | Bins with >0 counts | Bins with >2000 counts | High rate bins dominated by noise | Noise dominated (total time) | Noise dominated (detector-on time) | Marked lightcurve |
|---|---|---|---|---|---|---|---|
| A | 151730 | 89290 | 4243 | 4243 | 2.80% | 4.75% |  |
| B | 151730 | 89332 | 451 | 451 | 0.30% | 0.50% |  |
| C | 151730 | 89330 | 6351 | 6351 | 4.19% | 7.11% |  |
| D | 151730 | 89332 | 1623 | 1623 | 1.07% | 1.82% |  |
Top three noisy pixels from each quadrant. If the there are fewer than three noisy pixels in the level2.evt file, extra rows are filled as -1
| Pixel properties | Quadrant properties | ||||||
|---|---|---|---|---|---|---|---|
| Quadrant | DetID | PixID | Counts | Sigma | Mean | Median | Sigma |
| A | 13 | 9 | 14416098 | 7604.41 | 9554 | 9367 | 1894.5 |
| A | 0 | 50 | 5490306 | 2893.04 | 9554 | 9367 | 1894.5 |
| A | 14 | 249 | 2846744 | 1497.67 | 9554 | 9367 | 1894.5 |
| B | 8 | 3 | 4779680 | 2549.3 | 9917 | 9694 | 1871.1 |
| B | 14 | 167 | 790811 | 417.46 | 9917 | 9694 | 1871.1 |
| B | 0 | 219 | 775629 | 409.35 | 9917 | 9694 | 1871.1 |
| C | 0 | 219 | 20932190 | 9711.33 | 9318 | 9353 | 2154.5 |
| C | 1 | 192 | 1907247 | 880.91 | 9318 | 9353 | 2154.5 |
| C | 6 | 80 | 1075426 | 494.82 | 9318 | 9353 | 2154.5 |
| D | 13 | 114 | 6863970 | 2801.05 | 9368 | 9155 | 2447.2 |
| D | 7 | 80 | 3033999 | 1236.03 | 9368 | 9155 | 2447.2 |
| D | 12 | 1 | 573032 | 230.41 | 9368 | 9155 | 2447.2 |
Histogram calculated using DETX and DETY for each event in the final _common_clean file
| Quadrant A |  |
 |
Quadrant B |
|---|---|---|---|
| Quadrant D |  |
 |
Quadrant C |
| Plot type | Count rate plots | Images |
|---|---|---|
| Comparison with Poisson distribution Blue bars denote a histogram of data divided into 1 sec bins. Red curve is a Poisson curve with rate = median count rate of data. |
 |
 |
| Quadrant-wise count rates Data is divided into 100 sec bins |
 |
|
| Module-wise count rates for Quadrant A Data is divided into 100 sec bins |
 |
 |
| Module-wise count rates for Quadrant B Data is divided into 100 sec bins |
 |
 |
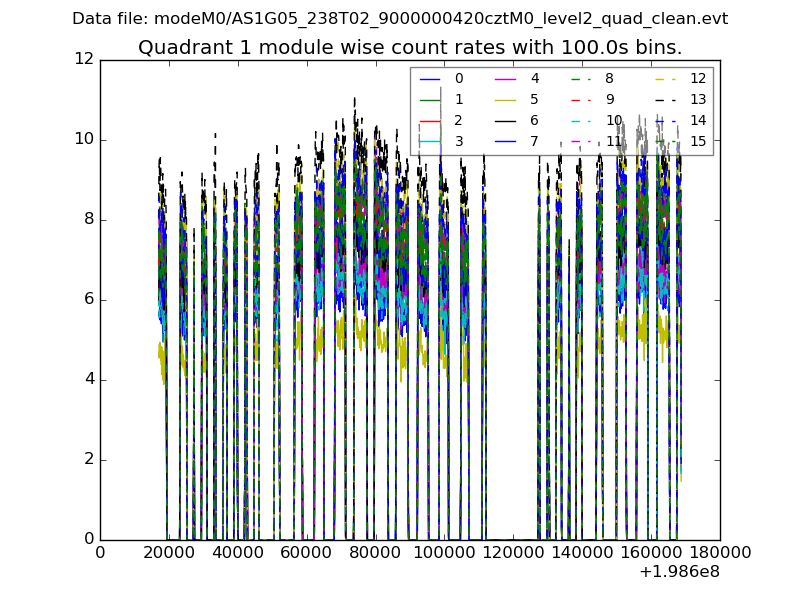
| Module-wise count rates for Quadrant C Data is divided into 100 sec bins |
 |
 |
| Module-wise count rates for Quadrant D Data is divided into 100 sec bins |
 |
 |
| Parameter | Plot |
|---|---|
| CZT HV Monitor |  |
| D_VDD |  |
| Temperature 1 |  |
| Veto HV Monitor |  |
| Veto LLD |  |
| Alpha Counter |  |
| _CPM_Rate |  |
| CZT Counter |  |
| +2.5 Volts monitor | 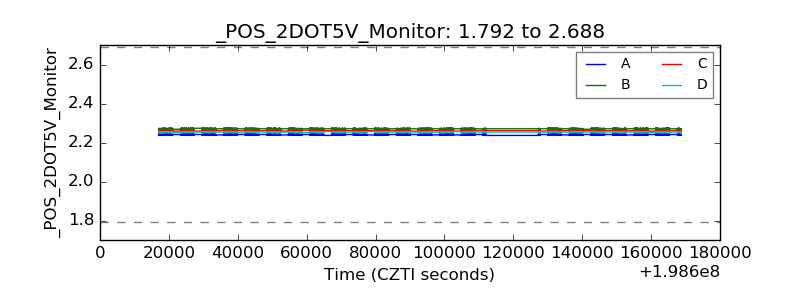 |
| +5 Volts monitor |  |
| _ROLL_ROT |  |
| _Roll_DEC |  |
| _Roll_RA |  |
| Veto Counter | 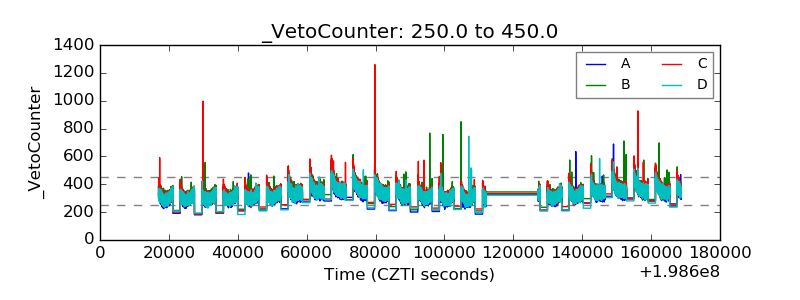 |