| Param | Original file | Final file |
|---|---|---|
| Filename | modeM0/AS1G05_238T05_9000000418cztM0_level2.evt | modeM0/AS1G05_238T05_9000000418cztM0_level2_quad_clean.evt |
| Size (bytes) | 7,509,401,280 | 1,143,576,000 |
| Size | 7.0 GB | 1.1 GB |
| Events in quadrant A | 69,137,100 | 7,022,971 |
| Events in quadrant B | 57,810,733 | 7,204,002 |
| Events in quadrant C | 42,332,795 | 7,202,882 |
| Events in quadrant D | 52,044,496 | 6,993,173 |
| Mode M0 | |||
|---|---|---|---|
| Quadrant | BADHDUFLAG | Total packets | Discarded packets |
| A | 0 | 267553 | 0 |
| B | 0 | 233899 | 0 |
| C | 0 | 191507 | 0 |
| D | 0 | 220065 | 0 |
| Mode SS | |||
|---|---|---|---|
| Quadrant | BADHDUFLAG | Total packets | Discarded packets |
| A | 0 | 1854 | 0 |
| B | 0 | 1854 | 0 |
| C | 0 | 1854 | 0 |
| D | 0 | 1854 | 0 |
| Mode M9 | |||
|---|---|---|---|
| Quadrant | BADHDUFLAG | Total packets | Discarded packets |
| A | 0 | 489 | 0 |
| B | 0 | 489 | 0 |
| C | 0 | 489 | 0 |
| D | 0 | 490 | 0 |
| Quadrant | Total seconds | Saturated seconds | Saturation percentage |
|---|---|---|---|
| A | 90639 | 5479 | 6.044859% |
| B | 90639 | 3885 | 4.286234% |
| C | 90639 | 725 | 0.799876% |
| D | 90639 | 1400 | 1.544589% |
Noise dominated data is calculated using 1-second bins in cleaned event files. If a bin has >2000 counts, and if more than 50% of those come from <1% of pixels, then it is considered to be noise-dominated and hence unusable.
| Quadrant | # 1 sec bins | Bins with >0 counts | Bins with >2000 counts | High rate bins dominated by noise | Noise dominated (total time) | Noise dominated (detector-on time) | Marked lightcurve |
|---|---|---|---|---|---|---|---|
| A | 135816 | 90662 | 4233 | 4233 | 3.12% | 4.67% | 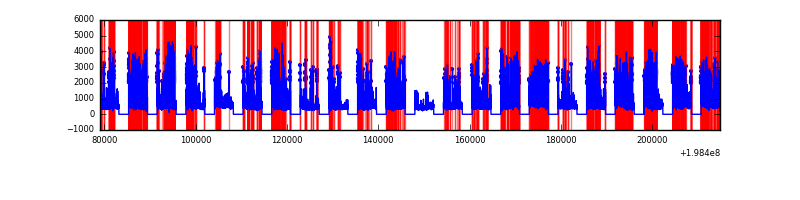 |
| B | 135816 | 90662 | 3525 | 3525 | 2.60% | 3.89% |  |
| C | 135816 | 90662 | 615 | 615 | 0.45% | 0.68% | 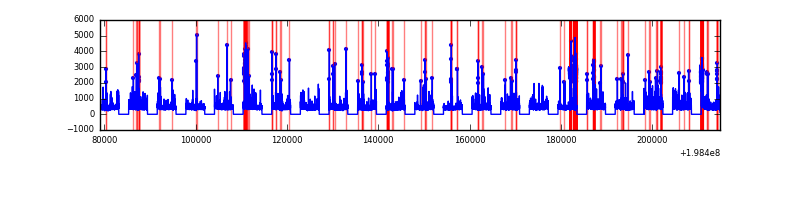 |
| D | 135816 | 90662 | 1319 | 1319 | 0.97% | 1.45% |  |
Top three noisy pixels from each quadrant. If the there are fewer than three noisy pixels in the level2.evt file, extra rows are filled as -1
| Pixel properties | Quadrant properties | ||||||
|---|---|---|---|---|---|---|---|
| Quadrant | DetID | PixID | Counts | Sigma | Mean | Median | Sigma |
| A | 13 | 9 | 23504161 | 12275.72 | 9550 | 9349 | 1913.9 |
| A | 14 | 249 | 2944154 | 1533.4 | 9550 | 9349 | 1913.9 |
| A | 12 | 247 | 2449273 | 1274.83 | 9550 | 9349 | 1913.9 |
| B | 15 | 204 | 8736030 | 4690.52 | 9811 | 9588 | 1860.4 |
| B | 8 | 3 | 3133558 | 1679.15 | 9811 | 9588 | 1860.4 |
| B | 2 | 249 | 2285218 | 1223.17 | 9811 | 9588 | 1860.4 |
| C | 0 | 219 | 2389964 | 1076.73 | 9512 | 9548 | 2210.8 |
| C | 6 | 80 | 1162715 | 521.61 | 9512 | 9548 | 2210.8 |
| C | 1 | 192 | 838742 | 375.07 | 9512 | 9548 | 2210.8 |
| D | 13 | 114 | 5945203 | 2432.15 | 9429 | 9198 | 2440.6 |
| D | 1 | 31 | 1937159 | 789.94 | 9429 | 9198 | 2440.6 |
| D | 7 | 80 | 1221123 | 496.56 | 9429 | 9198 | 2440.6 |
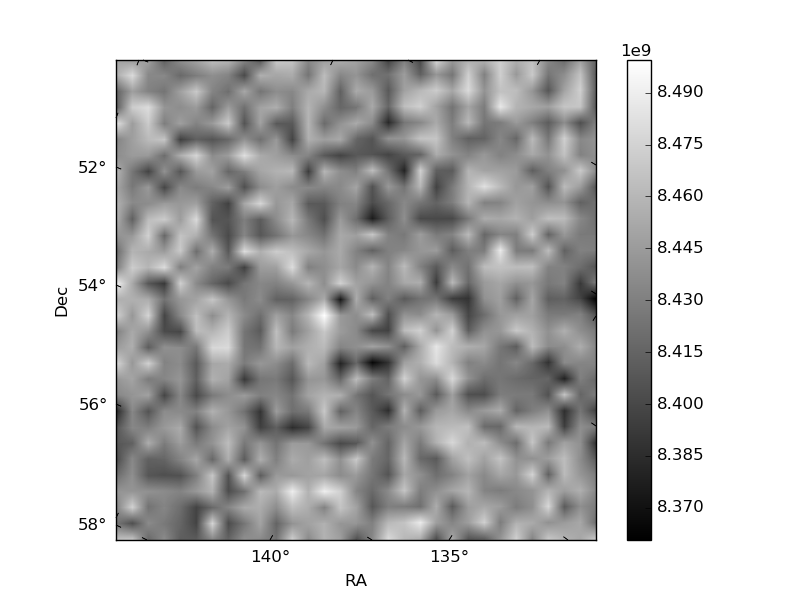
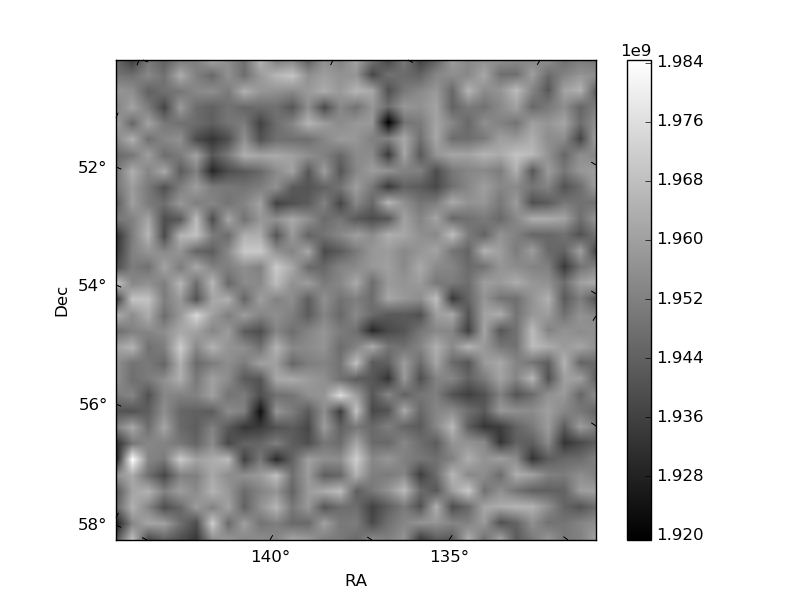
Histogram calculated using DETX and DETY for each event in the final _common_clean file
| Quadrant A |  |
 |
Quadrant B |
|---|---|---|---|
| Quadrant D |  |
 |
Quadrant C |
| Plot type | Count rate plots | Images |
|---|---|---|
| Comparison with Poisson distribution Blue bars denote a histogram of data divided into 1 sec bins. Red curve is a Poisson curve with rate = median count rate of data. |
 |
 |
| Quadrant-wise count rates Data is divided into 100 sec bins |
 |
|
| Module-wise count rates for Quadrant A Data is divided into 100 sec bins |
 |
 |
| Module-wise count rates for Quadrant B Data is divided into 100 sec bins |
 |
 |
| Module-wise count rates for Quadrant C Data is divided into 100 sec bins |
 |
 |
| Module-wise count rates for Quadrant D Data is divided into 100 sec bins |
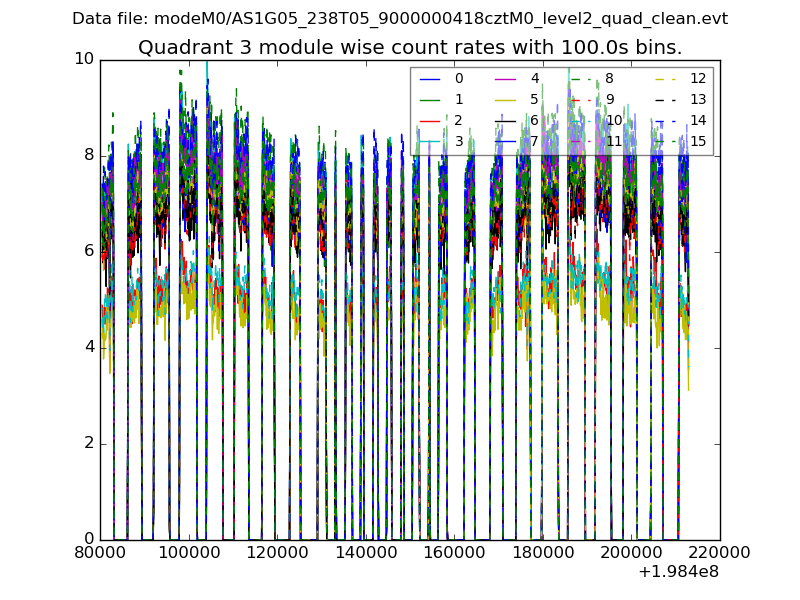 |
 |
| Parameter | Plot |
|---|---|
| CZT HV Monitor |  |
| D_VDD |  |
| Temperature 1 |  |
| Veto HV Monitor |  |
| Veto LLD |  |
| Alpha Counter |  |
| _CPM_Rate |  |
| CZT Counter |  |
| +2.5 Volts monitor |  |
| +5 Volts monitor |  |
| _ROLL_ROT |  |
| _Roll_DEC | 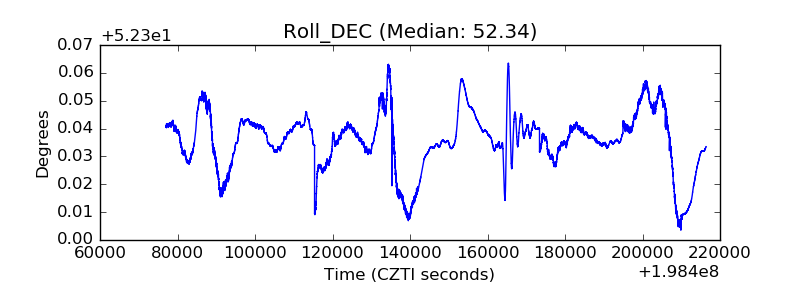 |
| _Roll_RA |  |
| Veto Counter |  |