| Param | Original file | Final file |
|---|---|---|
| Filename | modeM0/AS1G05_238T04_9000000416cztM0_level2_bc.evt | modeM0/AS1G05_238T04_9000000416cztM0_level2_quad_clean.evt |
| Size (bytes) | 4,615,902,720 | 1,243,002,240 |
| Size | 4.3 GB | 1.2 GB |
| Events in quadrant A | 30,554,691 | 7,628,474 |
| Events in quadrant B | 27,132,497 | 7,611,953 |
| Events in quadrant C | 30,153,146 | 7,604,052 |
| Events in quadrant D | 44,405,864 | 7,200,620 |
| Mode SS | |||
|---|---|---|---|
| Quadrant | BADHDUFLAG | Total packets | Discarded packets |
| A | 0 | 2274 | 0 |
| B | 0 | 2274 | 0 |
| C | 0 | 2274 | 0 |
| D | 0 | 2274 | 0 |
| Mode M9 | |||
|---|---|---|---|
| Quadrant | BADHDUFLAG | Total packets | Discarded packets |
| A | 0 | 579 | 0 |
| B | 0 | 579 | 0 |
| C | 0 | 579 | 0 |
| D | 0 | 579 | 0 |
| Mode M0 | |||
|---|---|---|---|
| Quadrant | BADHDUFLAG | Total packets | Discarded packets |
| A | 0 | 255331 | 0 |
| B | 0 | 243515 | 0 |
| C | 0 | 249111 | 0 |
| D | 0 | 312579 | 0 |
| Quadrant | Total seconds | Saturated seconds | Saturation percentage |
|---|---|---|---|
| A | 110960 | 2496 | 2.249459% |
| B | 110929 | 1258 | 1.134059% |
| C | 110943 | 1476 | 1.330413% |
| D | 110839 | 6502 | 5.866166% |
Noise dominated data is calculated using 1-second bins in cleaned event files. If a bin has >2000 counts, and if more than 50% of those come from <1% of pixels, then it is considered to be noise-dominated and hence unusable.
| Quadrant | # 1 sec bins | Bins with >0 counts | Bins with >2000 counts | High rate bins dominated by noise | Noise dominated (total time) | Noise dominated (detector-on time) | Marked lightcurve |
|---|---|---|---|---|---|---|---|
| A | 168853 | 110960 | 293 | 293 | 0.17% | 0.26% |  |
| B | 168853 | 110930 | 254 | 254 | 0.15% | 0.23% |  |
| C | 168853 | 110939 | 572 | 572 | 0.34% | 0.52% |  |
| D | 168853 | 110834 | 787 | 787 | 0.47% | 0.71% |  |
Top three noisy pixels from each quadrant. If the there are fewer than three noisy pixels in the level2.evt file, extra rows are filled as -1
| Pixel properties | Quadrant properties | ||||||
|---|---|---|---|---|---|---|---|
| Quadrant | DetID | PixID | Counts | Sigma | Mean | Median | Sigma |
| A | 13 | 9 | 4046474 | 3676.55 | 4994 | 4888 | 1099.3 |
| A | 14 | 238 | 2100686 | 1906.51 | 4994 | 4888 | 1099.3 |
| A | 0 | 31 | 1106052 | 1001.71 | 4994 | 4888 | 1099.3 |
| B | 2 | 249 | 2056880 | 2105.29 | 5066 | 4917 | 974.7 |
| B | 3 | 27 | 1039090 | 1061.05 | 5066 | 4917 | 974.7 |
| B | 0 | 219 | 729326 | 743.24 | 5066 | 4917 | 974.7 |
| C | 1 | 192 | 5798124 | 5110.4 | 4986 | 4891 | 1133.6 |
| C | 6 | 80 | 1572798 | 1383.1 | 4986 | 4891 | 1133.6 |
| C | 0 | 219 | 1195760 | 1050.5 | 4986 | 4891 | 1133.6 |
| D | 7 | 80 | 4257097 | 3601.55 | 4870 | 4714 | 1180.7 |
| D | 12 | 1 | 3403336 | 2878.46 | 4870 | 4714 | 1180.7 |
| D | 13 | 114 | 2419935 | 2045.57 | 4870 | 4714 | 1180.7 |
Histogram calculated using DETX and DETY for each event in the final _common_clean file
| Quadrant A | 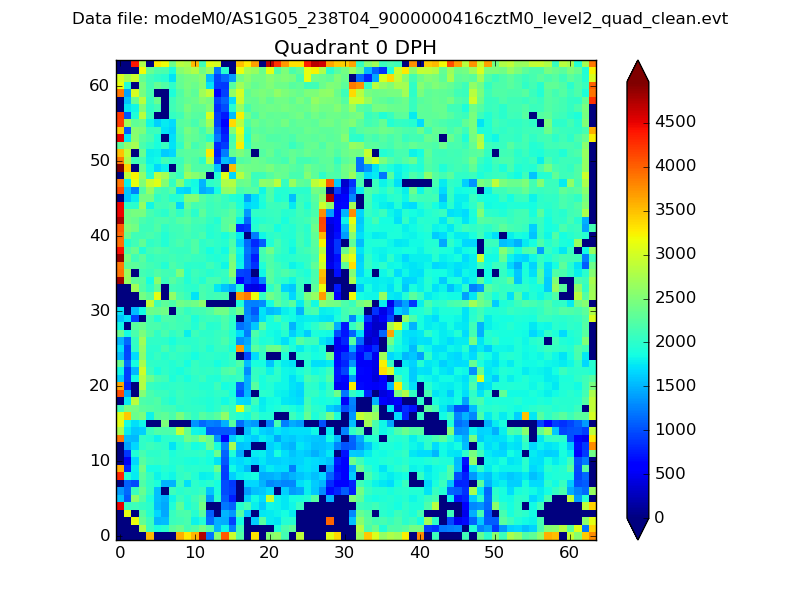 |
 |
Quadrant B |
|---|---|---|---|
| Quadrant D |  |
 |
Quadrant C |
| Plot type | Count rate plots | Images |
|---|---|---|
| Comparison with Poisson distribution Blue bars denote a histogram of data divided into 1 sec bins. Red curve is a Poisson curve with rate = median count rate of data. |
 |
 |
| Quadrant-wise count rates Data is divided into 100 sec bins |
 |
|
| Module-wise count rates for Quadrant A Data is divided into 100 sec bins |
 |
 |
| Module-wise count rates for Quadrant B Data is divided into 100 sec bins |
 |
 |
| Module-wise count rates for Quadrant C Data is divided into 100 sec bins |
 |
 |
| Module-wise count rates for Quadrant D Data is divided into 100 sec bins |
 |
 |
| Parameter | Plot |
|---|---|
| CZT HV Monitor |  |
| D_VDD |  |
| Temperature 1 | 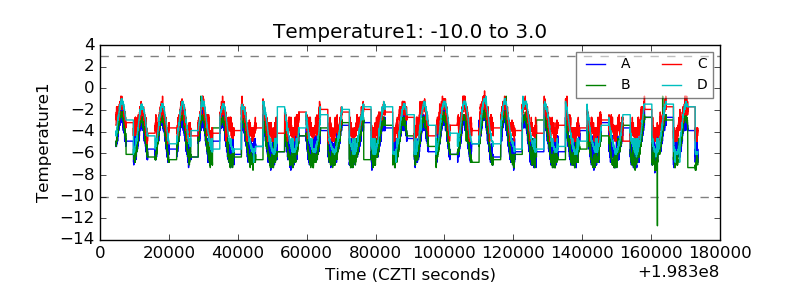 |
| Veto HV Monitor |  |
| Veto LLD |  |
| Alpha Counter |  |
| _CPM_Rate |  |
| CZT Counter |  |
| +2.5 Volts monitor |  |
| +5 Volts monitor | 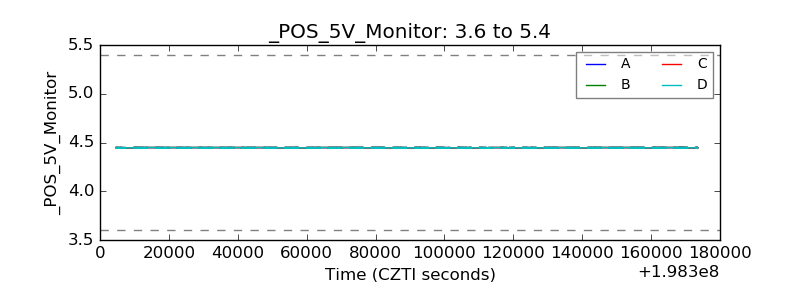 |
| _ROLL_ROT |  |
| _Roll_DEC |  |
| _Roll_RA |  |
| Veto Counter |  |