| Param | Original file | Final file |
|---|---|---|
| Filename | modeM0/AS1T01_055T01_9000000408cztM0_level2_bc.evt | modeM0/AS1T01_055T01_9000000408cztM0_level2_quad_clean.evt |
| Size (bytes) | 717,180,480 | 199,918,080 |
| Size | 684.0 MB | 190.7 MB |
| Events in quadrant A | 3,837,631 | 1,181,126 |
| Events in quadrant B | 5,438,845 | 1,160,078 |
| Events in quadrant C | 5,500,913 | 1,150,417 |
| Events in quadrant D | 5,527,501 | 1,139,699 |
| Mode M0 | |||
|---|---|---|---|
| Quadrant | BADHDUFLAG | Total packets | Discarded packets |
| A | 0 | 42490 | 0 |
| B | 0 | 47144 | 0 |
| C | 0 | 47676 | 0 |
| D | 0 | 47531 | 0 |
| Mode SS | |||
|---|---|---|---|
| Quadrant | BADHDUFLAG | Total packets | Discarded packets |
| A | 0 | 420 | 0 |
| B | 0 | 420 | 0 |
| C | 0 | 420 | 0 |
| D | 0 | 420 | 0 |
| Mode M9 | |||
|---|---|---|---|
| Quadrant | BADHDUFLAG | Total packets | Discarded packets |
| A | 0 | 13 | 0 |
| B | 0 | 13 | 0 |
| C | 0 | 13 | 0 |
| D | 0 | 13 | 0 |
| Quadrant | Total seconds | Saturated seconds | Saturation percentage |
|---|---|---|---|
| A | 20661 | 332 | 1.606892% |
| B | 20661 | 721 | 3.489667% |
| C | 20661 | 604 | 2.923382% |
| D | 20661 | 498 | 2.410338% |
Noise dominated data is calculated using 1-second bins in cleaned event files. If a bin has >2000 counts, and if more than 50% of those come from <1% of pixels, then it is considered to be noise-dominated and hence unusable.
| Quadrant | # 1 sec bins | Bins with >0 counts | Bins with >2000 counts | High rate bins dominated by noise | Noise dominated (total time) | Noise dominated (detector-on time) | Marked lightcurve |
|---|---|---|---|---|---|---|---|
| A | 21956 | 20660 | 4 | 4 | 0.02% | 0.02% | 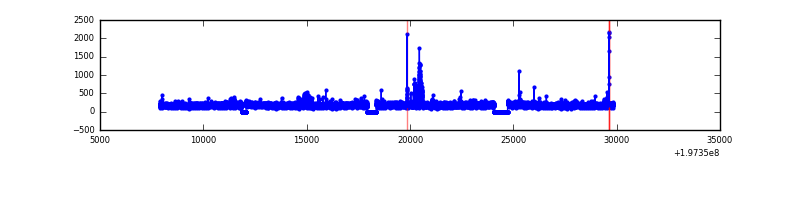 |
| B | 21956 | 20661 | 199 | 199 | 0.91% | 0.96% | 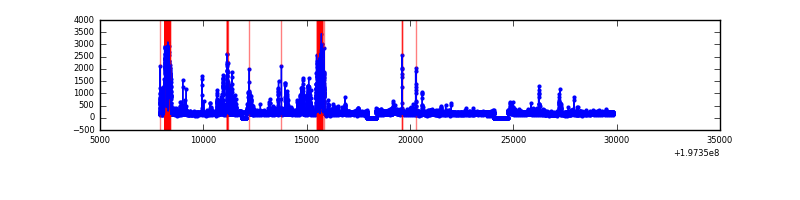 |
| C | 21956 | 20661 | 21 | 21 | 0.10% | 0.10% |  |
| D | 21956 | 20662 | 68 | 68 | 0.31% | 0.33% |  |
Top three noisy pixels from each quadrant. If the there are fewer than three noisy pixels in the level2.evt file, extra rows are filled as -1
| Pixel properties | Quadrant properties | ||||||
|---|---|---|---|---|---|---|---|
| Quadrant | DetID | PixID | Counts | Sigma | Mean | Median | Sigma |
| A | 8 | 15 | 120205 | 566.65 | 944 | 920 | 210.5 |
| A | 0 | 128 | 34939 | 161.6 | 944 | 920 | 210.5 |
| A | 0 | 149 | 12927 | 57.04 | 944 | 920 | 210.5 |
| B | 14 | 167 | 1393736 | 7920.91 | 946 | 912 | 175.8 |
| B | 0 | 189 | 112661 | 635.51 | 946 | 912 | 175.8 |
| B | 4 | 81 | 82886 | 466.18 | 946 | 912 | 175.8 |
| C | 2 | 53 | 1319461 | 6386.21 | 924 | 904 | 206.5 |
| C | 0 | 64 | 331349 | 1600.45 | 924 | 904 | 206.5 |
| C | 14 | 67 | 70122 | 335.25 | 924 | 904 | 206.5 |
| D | 5 | 233 | 443843 | 2044.1 | 924 | 889 | 216.7 |
| D | 13 | 169 | 359733 | 1655.96 | 924 | 889 | 216.7 |
| D | 2 | 184 | 251343 | 1155.77 | 924 | 889 | 216.7 |
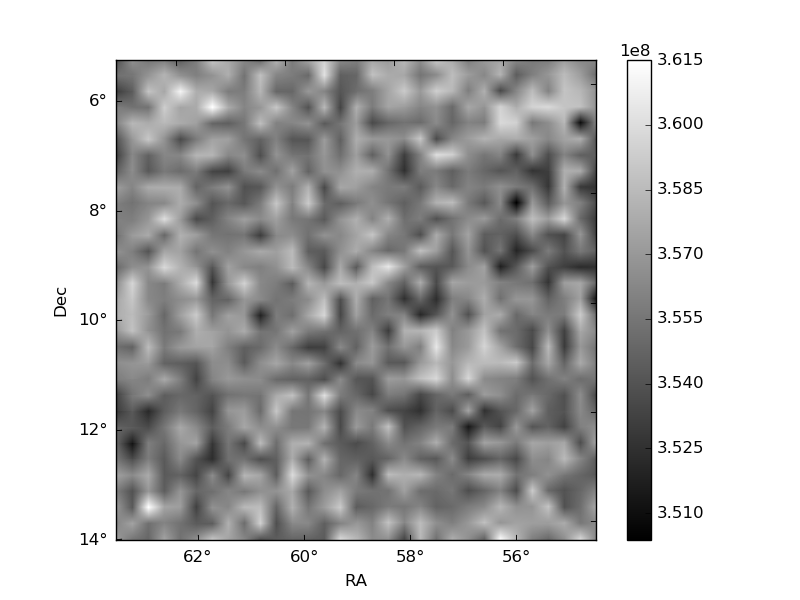
Histogram calculated using DETX and DETY for each event in the final _common_clean file
| Quadrant A | 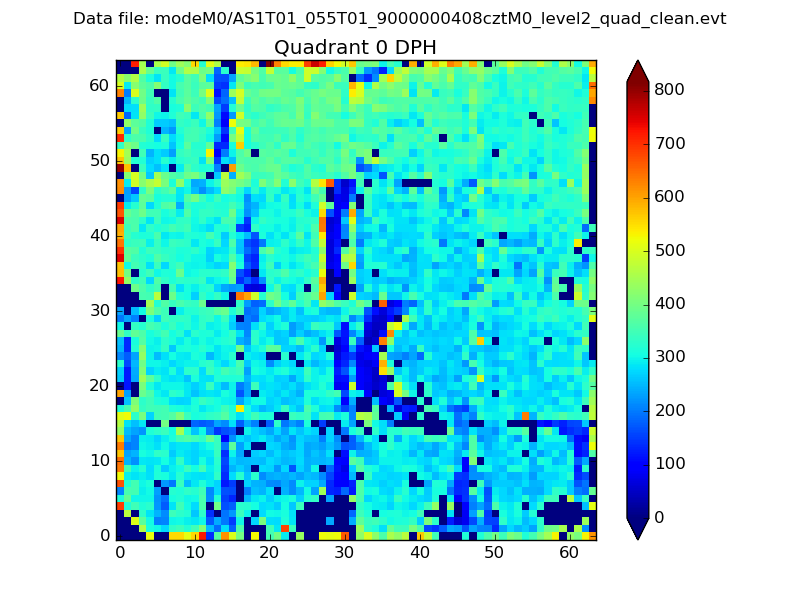 |
 |
Quadrant B |
|---|---|---|---|
| Quadrant D |  |
 |
Quadrant C |
| Plot type | Count rate plots | Images |
|---|---|---|
| Comparison with Poisson distribution Blue bars denote a histogram of data divided into 1 sec bins. Red curve is a Poisson curve with rate = median count rate of data. |
 |
 |
| Quadrant-wise count rates Data is divided into 100 sec bins |
 |
|
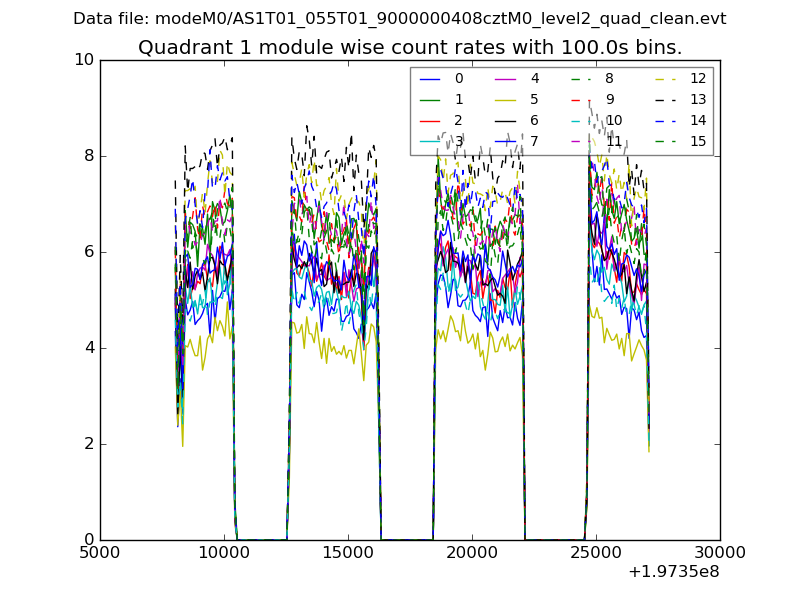
| Module-wise count rates for Quadrant A Data is divided into 100 sec bins |
 |
 |
| Module-wise count rates for Quadrant B Data is divided into 100 sec bins |
 |
 |
| Module-wise count rates for Quadrant C Data is divided into 100 sec bins |
 |
 |
| Module-wise count rates for Quadrant D Data is divided into 100 sec bins |
 |
 |
| Parameter | Plot |
|---|---|
| CZT HV Monitor |  |
| D_VDD |  |
| Temperature 1 | 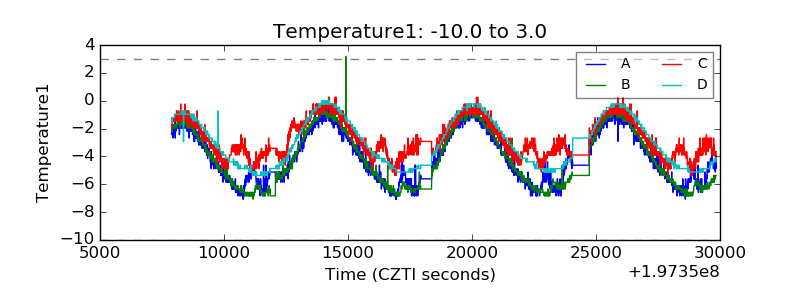 |
| Veto HV Monitor |  |
| Veto LLD |  |
| Alpha Counter | 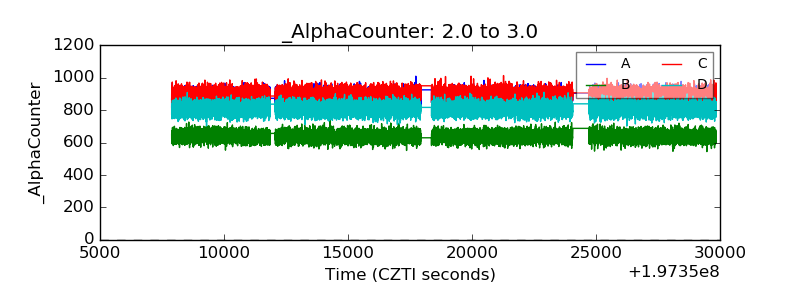 |
| _CPM_Rate |  |
| CZT Counter | 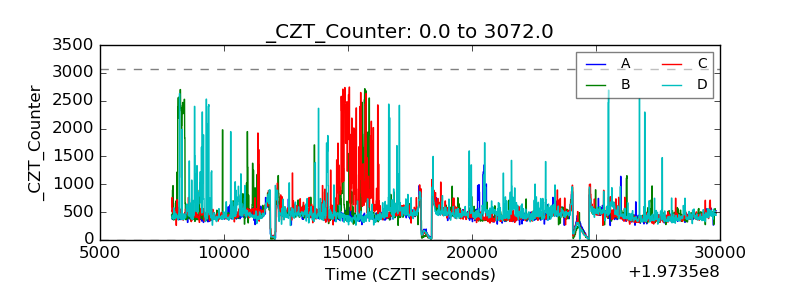 |
| +2.5 Volts monitor |  |
| +5 Volts monitor |  |
| _ROLL_ROT | 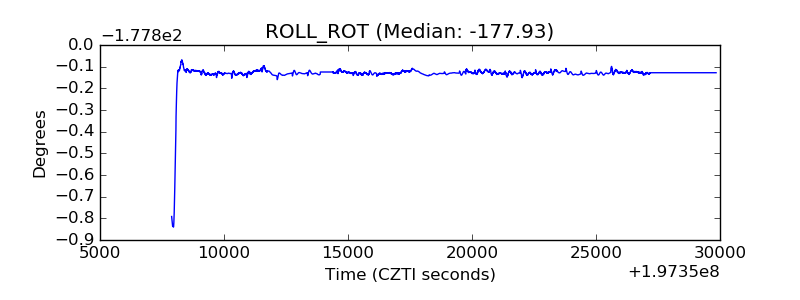 |
| _Roll_DEC | 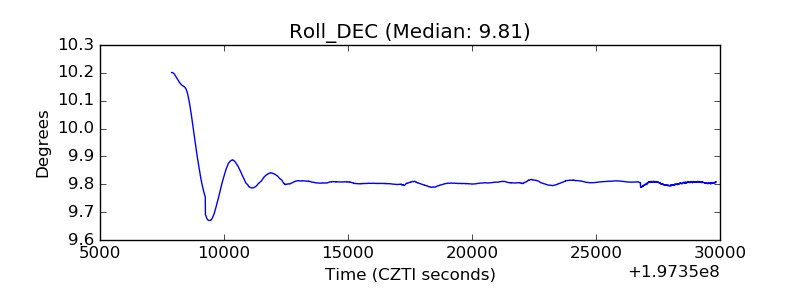 |
| _Roll_RA |  |
| Veto Counter |  |