| Param | Original file | Final file |
|---|---|---|
| Filename | modeM0/AS1T01_112T01_9000000406cztM0_level2_bc.evt | modeM0/AS1T01_112T01_9000000406cztM0_level2_quad_clean.evt |
| Size (bytes) | 6,852,896,640 | 2,546,354,880 |
| Size | 6.4 GB | 2.4 GB |
| Events in quadrant A | 45,193,660 | 16,208,512 |
| Events in quadrant B | 47,227,004 | 16,498,672 |
| Events in quadrant C | 46,300,789 | 16,108,826 |
| Events in quadrant D | 55,758,709 | 15,173,829 |
| Mode M0 | |||
|---|---|---|---|
| Quadrant | BADHDUFLAG | Total packets | Discarded packets |
| A | 0 | 437967 | 0 |
| B | 0 | 443130 | 0 |
| C | 0 | 441032 | 0 |
| D | 0 | 476423 | 0 |
| Mode SS | |||
|---|---|---|---|
| Quadrant | BADHDUFLAG | Total packets | Discarded packets |
| A | 0 | 2086 | 0 |
| B | 0 | 2086 | 0 |
| C | 0 | 2086 | 0 |
| D | 0 | 2086 | 0 |
| Mode M9 | |||
|---|---|---|---|
| Quadrant | BADHDUFLAG | Total packets | Discarded packets |
| A | 0 | 295 | 0 |
| B | 0 | 295 | 0 |
| C | 0 | 295 | 0 |
| D | 0 | 295 | 0 |
| Quadrant | Total seconds | Saturated seconds | Saturation percentage |
|---|---|---|---|
| A | 205192 | 3771 | 1.837791% |
| B | 205192 | 3784 | 1.844126% |
| C | 205192 | 3174 | 1.546844% |
| D | 205192 | 5111 | 2.490838% |
Noise dominated data is calculated using 1-second bins in cleaned event files. If a bin has >2000 counts, and if more than 50% of those come from <1% of pixels, then it is considered to be noise-dominated and hence unusable.
| Quadrant | # 1 sec bins | Bins with >0 counts | Bins with >2000 counts | High rate bins dominated by noise | Noise dominated (total time) | Noise dominated (detector-on time) | Marked lightcurve |
|---|---|---|---|---|---|---|---|
| A | 252952 | 205196 | 317 | 317 | 0.13% | 0.15% |  |
| B | 252952 | 205190 | 172 | 172 | 0.07% | 0.08% |  |
| C | 252952 | 205198 | 226 | 226 | 0.09% | 0.11% |  |
| D | 252952 | 205191 | 506 | 506 | 0.20% | 0.25% |  |
Top three noisy pixels from each quadrant. If the there are fewer than three noisy pixels in the level2.evt file, extra rows are filled as -1
| Pixel properties | Quadrant properties | ||||||
|---|---|---|---|---|---|---|---|
| Quadrant | DetID | PixID | Counts | Sigma | Mean | Median | Sigma |
| A | 0 | 128 | 4030639 | 1727.56 | 10295 | 10013 | 2327.4 |
| A | 8 | 15 | 750328 | 318.09 | 10295 | 10013 | 2327.4 |
| A | 0 | 149 | 520520 | 219.35 | 10295 | 10013 | 2327.4 |
| B | 14 | 167 | 3293258 | 1720.6 | 10510 | 10221 | 1908.1 |
| B | 10 | 244 | 941665 | 488.16 | 10510 | 10221 | 1908.1 |
| B | 6 | 36 | 805236 | 416.66 | 10510 | 10221 | 1908.1 |
| C | 2 | 53 | 3766980 | 1677.45 | 10183 | 10105 | 2239.6 |
| C | 14 | 223 | 1125232 | 497.91 | 10183 | 10105 | 2239.6 |
| C | 10 | 65 | 293057 | 126.34 | 10183 | 10105 | 2239.6 |
| D | 13 | 169 | 3396964 | 1440.18 | 9993 | 9685 | 2352.0 |
| D | 1 | 31 | 2279802 | 965.2 | 9993 | 9685 | 2352.0 |
| D | 13 | 53 | 2270940 | 961.43 | 9993 | 9685 | 2352.0 |
Histogram calculated using DETX and DETY for each event in the final _common_clean file
| Quadrant A | 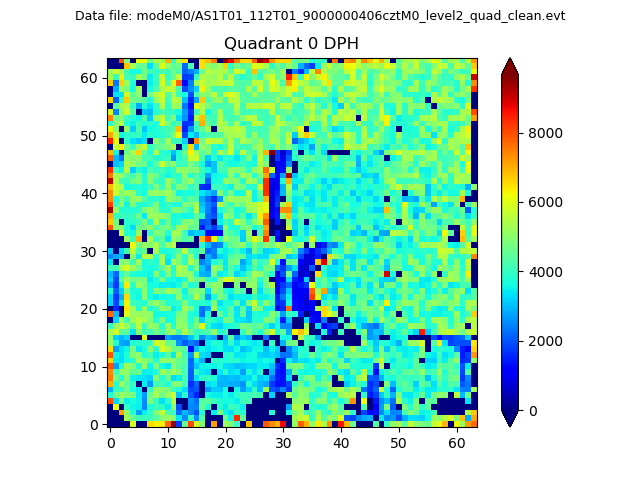 |
 |
Quadrant B |
|---|---|---|---|
| Quadrant D |  |
 |
Quadrant C |
| Plot type | Count rate plots | Images |
|---|---|---|
| Comparison with Poisson distribution Blue bars denote a histogram of data divided into 1 sec bins. Red curve is a Poisson curve with rate = median count rate of data. |
 |
 |
| Quadrant-wise count rates Data is divided into 100 sec bins |
 |
|
| Module-wise count rates for Quadrant A Data is divided into 100 sec bins |
 |
 |
| Module-wise count rates for Quadrant B Data is divided into 100 sec bins |
 |
 |
| Module-wise count rates for Quadrant C Data is divided into 100 sec bins |
 |
 |
| Module-wise count rates for Quadrant D Data is divided into 100 sec bins |
 |
 |
| Parameter | Plot |
|---|---|
| CZT HV Monitor |  |
| D_VDD | 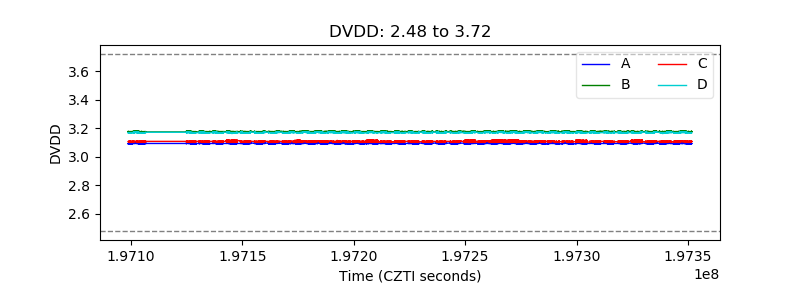 |
| Temperature 1 |  |
| Veto HV Monitor |  |
| Veto LLD |  |
| Alpha Counter |  |
| _CPM_Rate |  |
| CZT Counter |  |
| +2.5 Volts monitor |  |
| +5 Volts monitor |  |
| _ROLL_ROT |  |
| _Roll_DEC |  |
| _Roll_RA |  |
| Veto Counter |  |