| Param | Original file | Final file |
|---|---|---|
| Filename | modeM0/AS1T01_105T01_9000000402cztM0_level2.evt | modeM0/AS1T01_105T01_9000000402cztM0_level2_quad_clean.evt |
| Size (bytes) | 1,741,685,760 | 299,151,360 |
| Size | 1.6 GB | 285.3 MB |
| Events in quadrant A | 11,256,055 | 1,824,172 |
| Events in quadrant B | 14,962,808 | 1,872,411 |
| Events in quadrant C | 11,491,310 | 1,877,116 |
| Events in quadrant D | 13,360,787 | 1,780,089 |
| Mode M9 | |||
|---|---|---|---|
| Quadrant | BADHDUFLAG | Total packets | Discarded packets |
| A | 0 | 24 | 0 |
| B | 0 | 24 | 0 |
| C | 0 | 24 | 0 |
| D | 0 | 25 | 0 |
| Mode SS | |||
|---|---|---|---|
| Quadrant | BADHDUFLAG | Total packets | Discarded packets |
| A | 0 | 500 | 0 |
| B | 0 | 500 | 0 |
| C | 0 | 500 | 0 |
| D | 0 | 500 | 0 |
| Mode M0 | |||
|---|---|---|---|
| Quadrant | BADHDUFLAG | Total packets | Discarded packets |
| A | 0 | 51409 | 0 |
| B | 0 | 61605 | 0 |
| C | 0 | 51780 | 0 |
| D | 0 | 57570 | 0 |
| Quadrant | Total seconds | Saturated seconds | Saturation percentage |
|---|---|---|---|
| A | 24806 | 481 | 1.939047% |
| B | 24806 | 871 | 3.511247% |
| C | 24806 | 313 | 1.261792% |
| D | 24806 | 669 | 2.696928% |
Noise dominated data is calculated using 1-second bins in cleaned event files. If a bin has >2000 counts, and if more than 50% of those come from <1% of pixels, then it is considered to be noise-dominated and hence unusable.
| Quadrant | # 1 sec bins | Bins with >0 counts | Bins with >2000 counts | High rate bins dominated by noise | Noise dominated (total time) | Noise dominated (detector-on time) | Marked lightcurve |
|---|---|---|---|---|---|---|---|
| A | 26644 | 24809 | 0 | 0 | 0.00% | 0.00% |  |
| B | 26644 | 24809 | 201 | 201 | 0.75% | 0.81% |  |
| C | 26644 | 24809 | 9 | 9 | 0.03% | 0.04% | 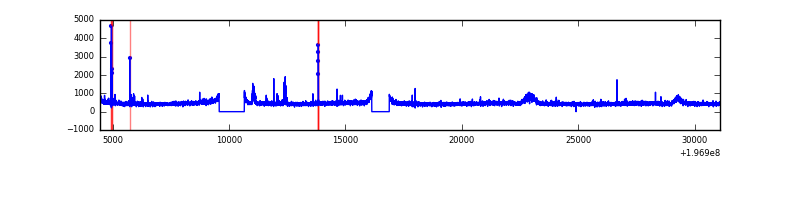 |
| D | 26644 | 24809 | 290 | 290 | 1.09% | 1.17% |  |
Top three noisy pixels from each quadrant. If the there are fewer than three noisy pixels in the level2.evt file, extra rows are filled as -1
| Pixel properties | Quadrant properties | ||||||
|---|---|---|---|---|---|---|---|
| Quadrant | DetID | PixID | Counts | Sigma | Mean | Median | Sigma |
| A | 3 | 1 | 69626 | 111.99 | 2908 | 2835 | 596.4 |
| A | 12 | 194 | 32218 | 49.27 | 2908 | 2835 | 596.4 |
| A | 0 | 226 | 30639 | 46.62 | 2908 | 2835 | 596.4 |
| B | 14 | 53 | 2731157 | 4862.37 | 2937 | 2857 | 561.1 |
| B | 7 | 205 | 757787 | 1345.43 | 2937 | 2857 | 561.1 |
| B | 3 | 0 | 68493 | 116.98 | 2937 | 2857 | 561.1 |
| C | 14 | 223 | 113547 | 165.88 | 2860 | 2875 | 667.2 |
| C | 2 | 53 | 85188 | 123.37 | 2860 | 2875 | 667.2 |
| C | 8 | 112 | 30730 | 41.75 | 2860 | 2875 | 667.2 |
| D | 2 | 184 | 1341554 | 2015.13 | 2810 | 2742 | 664.4 |
| D | 9 | 64 | 428756 | 641.22 | 2810 | 2742 | 664.4 |
| D | 2 | 136 | 280829 | 418.57 | 2810 | 2742 | 664.4 |
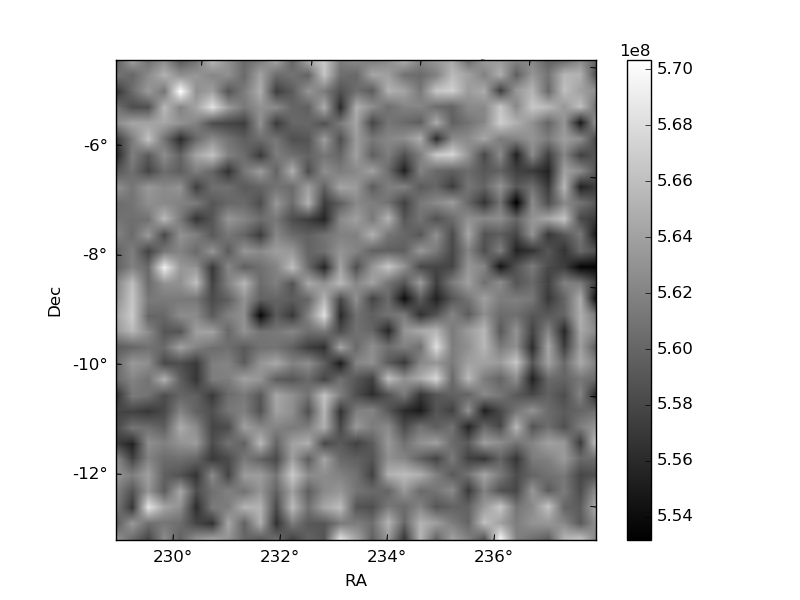
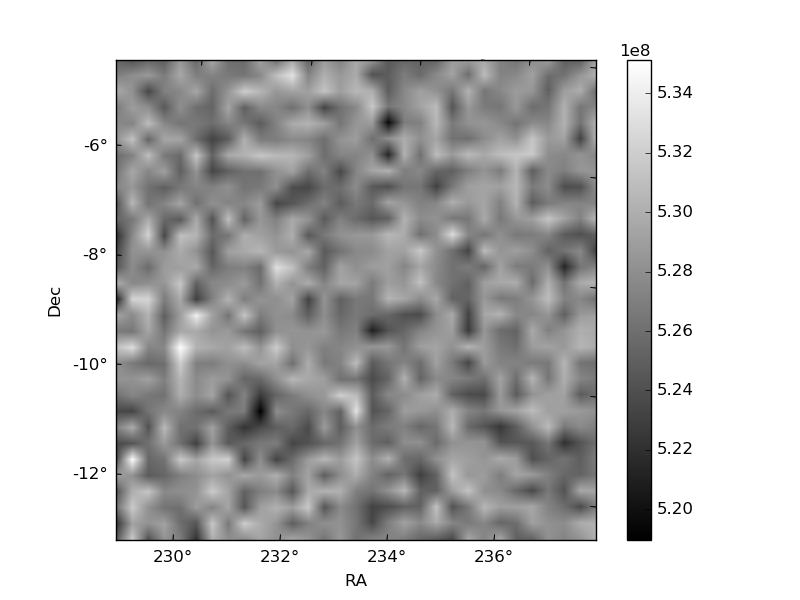
Histogram calculated using DETX and DETY for each event in the final _common_clean file
| Quadrant A |  |
 |
Quadrant B |
|---|---|---|---|
| Quadrant D |  |
 |
Quadrant C |
| Plot type | Count rate plots | Images |
|---|---|---|
| Comparison with Poisson distribution Blue bars denote a histogram of data divided into 1 sec bins. Red curve is a Poisson curve with rate = median count rate of data. |
 |
 |
| Quadrant-wise count rates Data is divided into 100 sec bins |
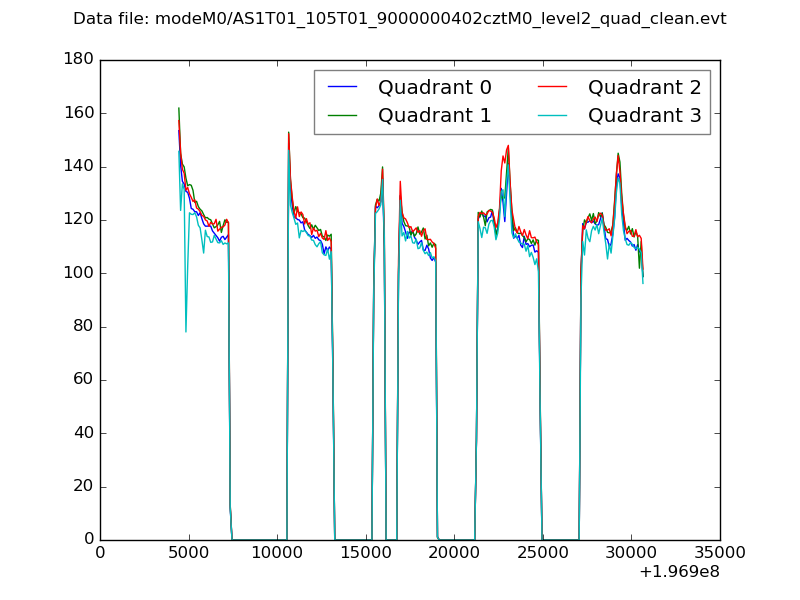 |
|
| Module-wise count rates for Quadrant A Data is divided into 100 sec bins |
 |
 |
| Module-wise count rates for Quadrant B Data is divided into 100 sec bins |
 |
 |
| Module-wise count rates for Quadrant C Data is divided into 100 sec bins |
 |
 |
| Module-wise count rates for Quadrant D Data is divided into 100 sec bins |
 |
 |
| Parameter | Plot |
|---|---|
| CZT HV Monitor | 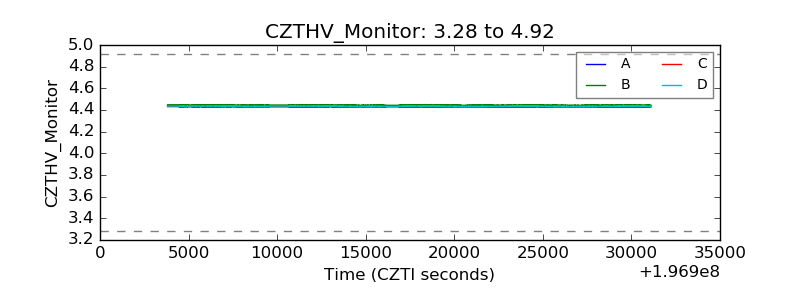 |
| D_VDD | 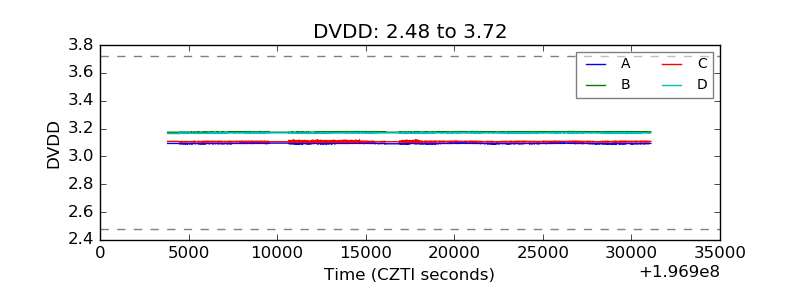 |
| Temperature 1 |  |
| Veto HV Monitor |  |
| Veto LLD |  |
| Alpha Counter |  |
| _CPM_Rate |  |
| CZT Counter | 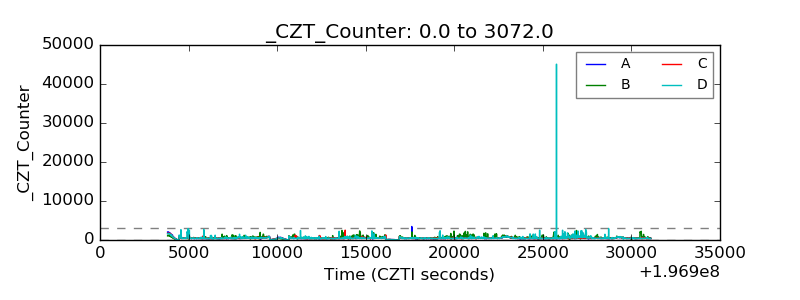 |
| +2.5 Volts monitor |  |
| +5 Volts monitor |  |
| _ROLL_ROT | 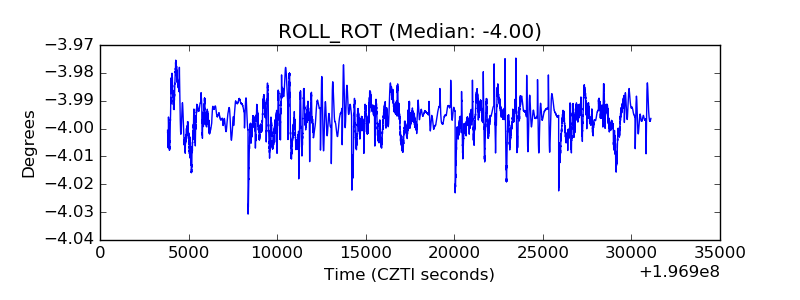 |
| _Roll_DEC | 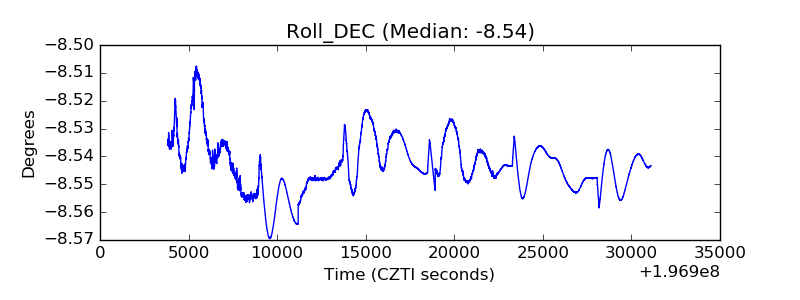 |
| _Roll_RA |  |
| Veto Counter |  |