| Param | Original file | Final file |
|---|---|---|
| Filename | modeM0/AS1T01_113T01_9000000400cztM0_level2.evt | modeM0/AS1T01_113T01_9000000400cztM0_level2_quad_clean.evt |
| Size (bytes) | 6,504,546,240 | 1,296,774,720 |
| Size | 6.1 GB | 1.2 GB |
| Events in quadrant A | 44,997,176 | 8,210,823 |
| Events in quadrant B | 50,367,121 | 8,315,975 |
| Events in quadrant C | 45,043,542 | 8,133,458 |
| Events in quadrant D | 49,812,834 | 7,747,000 |
| Mode SS | |||
|---|---|---|---|
| Quadrant | BADHDUFLAG | Total packets | Discarded packets |
| A | 0 | 2038 | 0 |
| B | 0 | 2038 | 0 |
| C | 0 | 2038 | 0 |
| D | 0 | 2038 | 0 |
| Mode M0 | |||
|---|---|---|---|
| Quadrant | BADHDUFLAG | Total packets | Discarded packets |
| A | 0 | 205722 | 0 |
| B | 0 | 219230 | 0 |
| C | 0 | 205743 | 0 |
| D | 0 | 221293 | 0 |
| Mode M9 | |||
|---|---|---|---|
| Quadrant | BADHDUFLAG | Total packets | Discarded packets |
| A | 0 | 159 | 0 |
| B | 0 | 159 | 0 |
| C | 0 | 159 | 0 |
| D | 0 | 160 | 0 |
| Quadrant | Total seconds | Saturated seconds | Saturation percentage |
|---|---|---|---|
| A | 100266 | 1099 | 1.096084% |
| B | 100266 | 1863 | 1.858058% |
| C | 100266 | 729 | 0.727066% |
| D | 100266 | 1470 | 1.466100% |
Noise dominated data is calculated using 1-second bins in cleaned event files. If a bin has >2000 counts, and if more than 50% of those come from <1% of pixels, then it is considered to be noise-dominated and hence unusable.
| Quadrant | # 1 sec bins | Bins with >0 counts | Bins with >2000 counts | High rate bins dominated by noise | Noise dominated (total time) | Noise dominated (detector-on time) | Marked lightcurve |
|---|---|---|---|---|---|---|---|
| A | 116031 | 100277 | 2 | 2 | 0.00% | 0.00% |  |
| B | 116031 | 100279 | 527 | 527 | 0.45% | 0.53% | 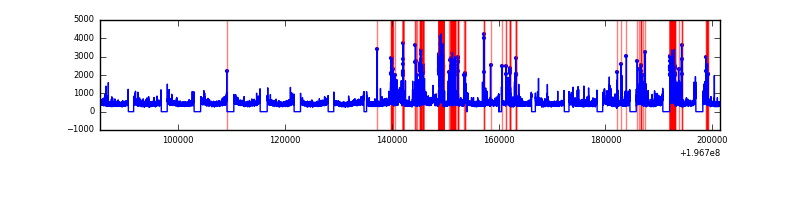 |
| C | 116031 | 100282 | 14 | 14 | 0.01% | 0.01% |  |
| D | 116031 | 100282 | 618 | 618 | 0.53% | 0.62% | 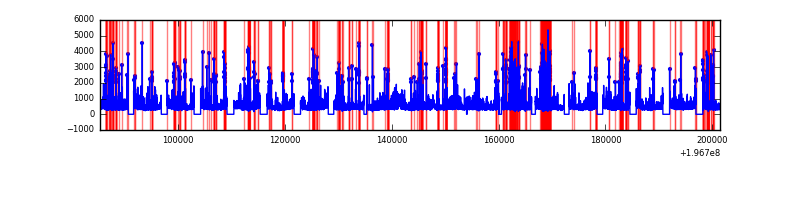 |
Top three noisy pixels from each quadrant. If the there are fewer than three noisy pixels in the level2.evt file, extra rows are filled as -1
| Pixel properties | Quadrant properties | ||||||
|---|---|---|---|---|---|---|---|
| Quadrant | DetID | PixID | Counts | Sigma | Mean | Median | Sigma |
| A | 12 | 194 | 128563 | 49.7 | 11662 | 11402 | 2357.2 |
| A | 0 | 226 | 122986 | 47.34 | 11662 | 11402 | 2357.2 |
| A | 12 | 133 | 92475 | 34.39 | 11662 | 11402 | 2357.2 |
| B | 14 | 167 | 2331924 | 1041.49 | 11822 | 11517 | 2228.0 |
| B | 14 | 53 | 1971479 | 879.71 | 11822 | 11517 | 2228.0 |
| B | 7 | 205 | 320534 | 138.7 | 11822 | 11517 | 2228.0 |
| C | 14 | 223 | 121335 | 41.82 | 11400 | 11460 | 2627.2 |
| C | 13 | 61 | 101958 | 34.45 | 11400 | 11460 | 2627.2 |
| C | 2 | 53 | 96932 | 32.53 | 11400 | 11460 | 2627.2 |
| D | 2 | 184 | 2994340 | 1124.34 | 11210 | 10942 | 2653.5 |
| D | 7 | 67 | 917385 | 341.61 | 11210 | 10942 | 2653.5 |
| D | 2 | 136 | 901739 | 335.71 | 11210 | 10942 | 2653.5 |
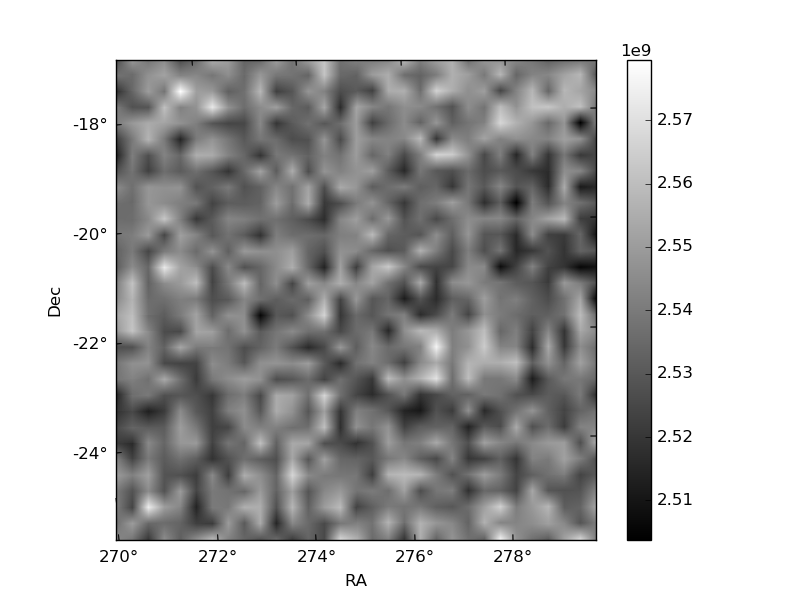
Histogram calculated using DETX and DETY for each event in the final _common_clean file
| Quadrant A | 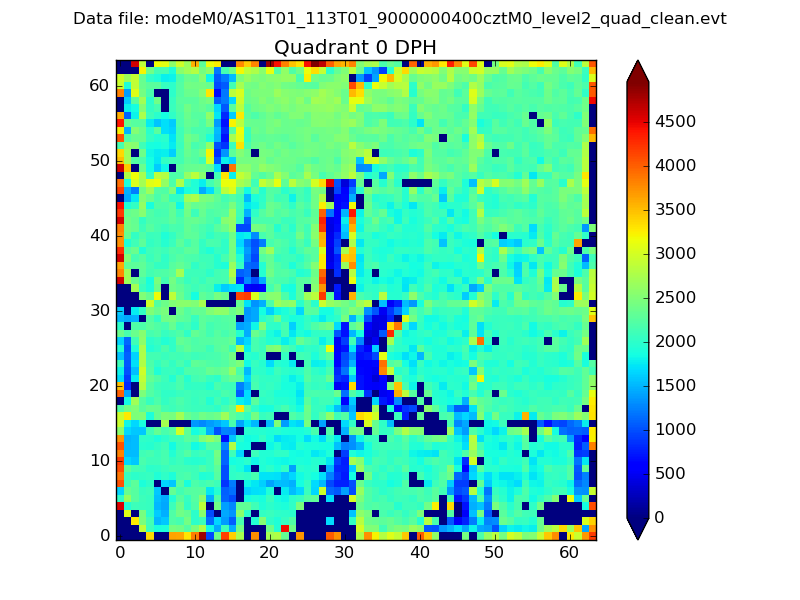 |
 |
Quadrant B |
|---|---|---|---|
| Quadrant D |  |
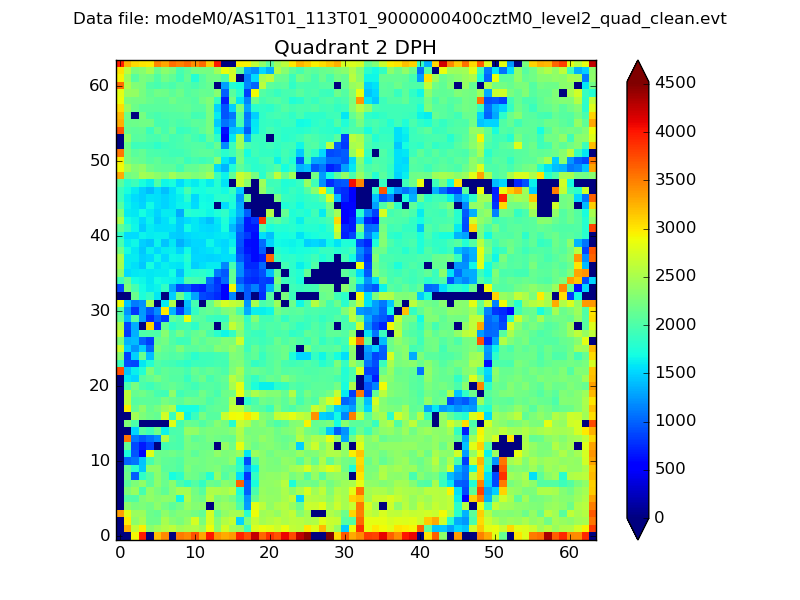 |
Quadrant C |
| Plot type | Count rate plots | Images |
|---|---|---|
| Comparison with Poisson distribution Blue bars denote a histogram of data divided into 1 sec bins. Red curve is a Poisson curve with rate = median count rate of data. |
 |
 |
| Quadrant-wise count rates Data is divided into 100 sec bins |
 |
|
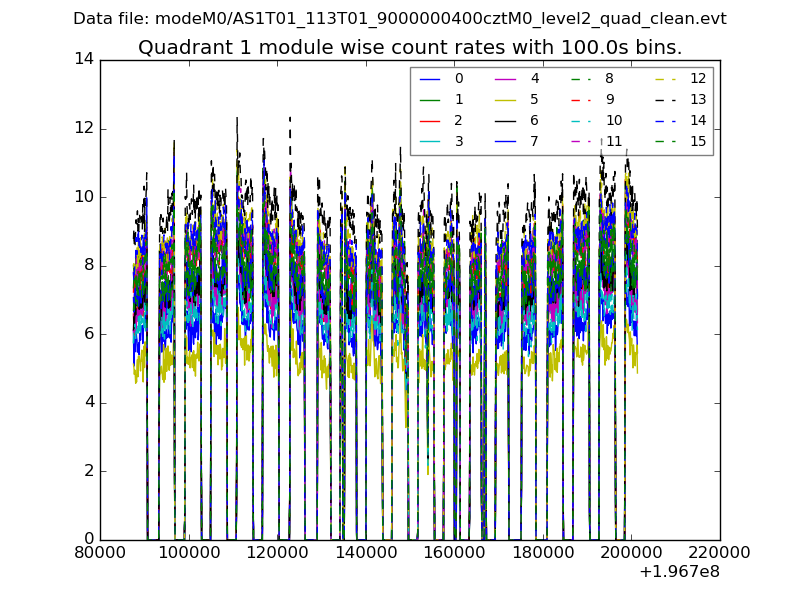
| Module-wise count rates for Quadrant A Data is divided into 100 sec bins |
 |
 |
| Module-wise count rates for Quadrant B Data is divided into 100 sec bins |
 |
 |
| Module-wise count rates for Quadrant C Data is divided into 100 sec bins |
 |
 |
| Module-wise count rates for Quadrant D Data is divided into 100 sec bins |
 |
 |
| Parameter | Plot |
|---|---|
| CZT HV Monitor | 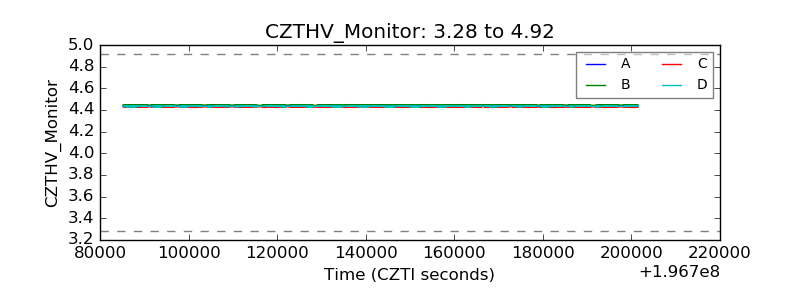 |
| D_VDD |  |
| Temperature 1 | 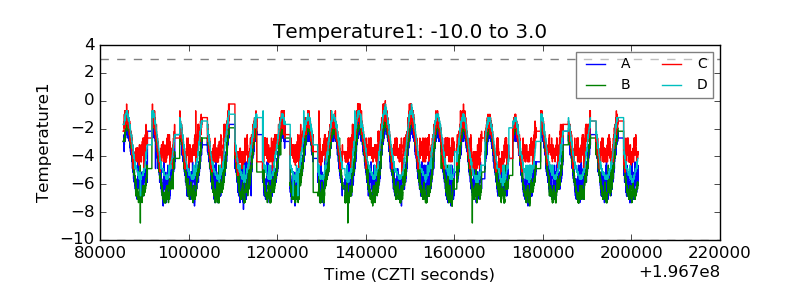 |
| Veto HV Monitor |  |
| Veto LLD |  |
| Alpha Counter |  |
| _CPM_Rate | 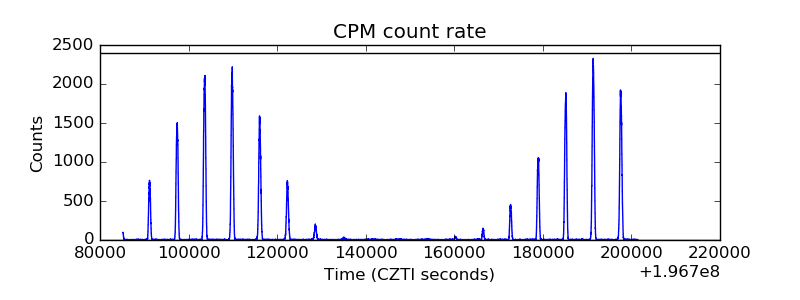 |
| CZT Counter |  |
| +2.5 Volts monitor |  |
| +5 Volts monitor |  |
| _ROLL_ROT | 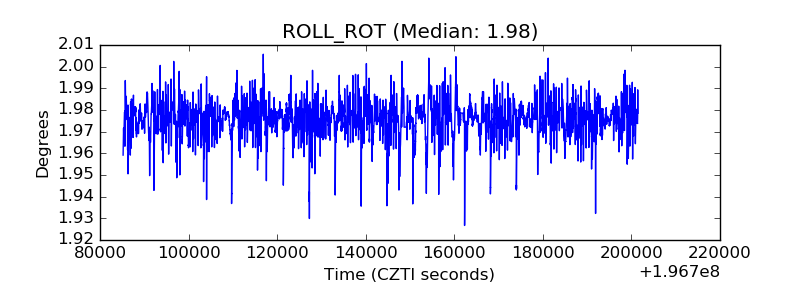 |
| _Roll_DEC |  |
| _Roll_RA |  |
| Veto Counter |  |