| Param | Original file | Final file |
|---|---|---|
| Filename | modeM0/AS1P01_010T01_9000000398cztM0_level2_bc.evt | modeM0/AS1P01_010T01_9000000398cztM0_level2_quad_clean.evt |
| Size (bytes) | 6,015,404,160 | 2,432,462,400 |
| Size | 5.6 GB | 2.3 GB |
| Events in quadrant A | 30,956,524 | 15,969,299 |
| Events in quadrant B | 31,888,244 | 16,076,000 |
| Events in quadrant C | 63,745,216 | 15,237,699 |
| Events in quadrant D | 44,389,272 | 15,130,946 |
| Mode SS | |||
|---|---|---|---|
| Quadrant | BADHDUFLAG | Total packets | Discarded packets |
| A | 0 | 3338 | 0 |
| B | 0 | 3338 | 0 |
| C | 0 | 3338 | 0 |
| D | 0 | 3338 | 0 |
| Mode M9 | |||
|---|---|---|---|
| Quadrant | BADHDUFLAG | Total packets | Discarded packets |
| A | 0 | 237 | 0 |
| B | 0 | 237 | 0 |
| C | 0 | 237 | 0 |
| D | 0 | 238 | 0 |
| Mode M0 | |||
|---|---|---|---|
| Quadrant | BADHDUFLAG | Total packets | Discarded packets |
| A | 0 | 335450 | 0 |
| B | 0 | 338056 | 0 |
| C | 0 | 492783 | 0 |
| D | 0 | 379784 | 0 |
| Quadrant | Total seconds | Saturated seconds | Saturation percentage |
|---|---|---|---|
| A | 164422 | 1628 | 0.990135% |
| B | 164422 | 1758 | 1.069200% |
| C | 164400 | 11873 | 7.222019% |
| D | 164420 | 3664 | 2.228439% |
Noise dominated data is calculated using 1-second bins in cleaned event files. If a bin has >2000 counts, and if more than 50% of those come from <1% of pixels, then it is considered to be noise-dominated and hence unusable.
| Quadrant | # 1 sec bins | Bins with >0 counts | Bins with >2000 counts | High rate bins dominated by noise | Noise dominated (total time) | Noise dominated (detector-on time) | Marked lightcurve |
|---|---|---|---|---|---|---|---|
| A | 201666 | 164426 | 0 | 0 | 0.00% | 0.00% |  |
| B | 201666 | 164427 | 26 | 26 | 0.01% | 0.02% |  |
| C | 201666 | 164404 | 124 | 124 | 0.06% | 0.08% |  |
| D | 201666 | 164423 | 520 | 520 | 0.26% | 0.32% |  |
Top three noisy pixels from each quadrant. If the there are fewer than three noisy pixels in the level2.evt file, extra rows are filled as -1
| Pixel properties | Quadrant properties | ||||||
|---|---|---|---|---|---|---|---|
| Quadrant | DetID | PixID | Counts | Sigma | Mean | Median | Sigma |
| A | 14 | 63 | 360724 | 208.06 | 7790 | 7620 | 1697.1 |
| A | 8 | 15 | 202241 | 114.68 | 7790 | 7620 | 1697.1 |
| A | 8 | 176 | 120109 | 66.28 | 7790 | 7620 | 1697.1 |
| B | 10 | 244 | 314726 | 215.32 | 7884 | 7633 | 1426.2 |
| B | 14 | 167 | 293116 | 200.17 | 7884 | 7633 | 1426.2 |
| B | 15 | 85 | 261464 | 177.98 | 7884 | 7633 | 1426.2 |
| C | 9 | 70 | 32568924 | 20057.27 | 7399 | 7276 | 1623.4 |
| C | 2 | 53 | 766501 | 467.67 | 7399 | 7276 | 1623.4 |
| C | 14 | 223 | 343545 | 207.13 | 7399 | 7276 | 1623.4 |
| D | 2 | 184 | 6462865 | 3723.84 | 7516 | 7295 | 1733.6 |
| D | 13 | 169 | 1485548 | 852.72 | 7516 | 7295 | 1733.6 |
| D | 13 | 223 | 1128712 | 646.88 | 7516 | 7295 | 1733.6 |
Histogram calculated using DETX and DETY for each event in the final _common_clean file
| Quadrant A |  |
 |
Quadrant B |
|---|---|---|---|
| Quadrant D | 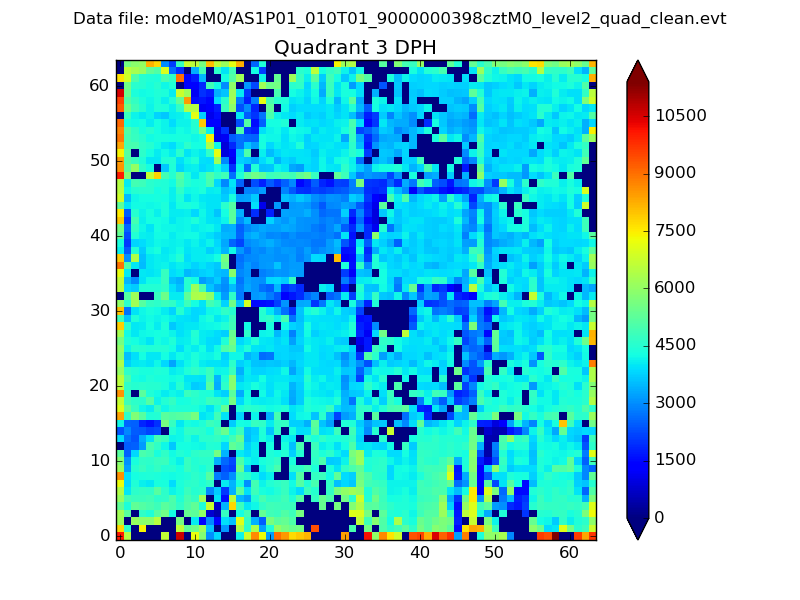 |
 |
Quadrant C |
| Plot type | Count rate plots | Images |
|---|---|---|
| Comparison with Poisson distribution Blue bars denote a histogram of data divided into 1 sec bins. Red curve is a Poisson curve with rate = median count rate of data. |
 |
 |
| Quadrant-wise count rates Data is divided into 100 sec bins |
 |
|
| Module-wise count rates for Quadrant A Data is divided into 100 sec bins |
 |
 |
| Module-wise count rates for Quadrant B Data is divided into 100 sec bins |
 |
 |
| Module-wise count rates for Quadrant C Data is divided into 100 sec bins |
 |
 |
| Module-wise count rates for Quadrant D Data is divided into 100 sec bins |
 |
 |
| Parameter | Plot |
|---|---|
| CZT HV Monitor |  |
| D_VDD |  |
| Temperature 1 |  |
| Veto HV Monitor |  |
| Veto LLD |  |
| Alpha Counter |  |
| _CPM_Rate |  |
| CZT Counter |  |
| +2.5 Volts monitor |  |
| +5 Volts monitor |  |
| _ROLL_ROT |  |
| _Roll_DEC |  |
| _Roll_RA |  |
| Veto Counter |  |