| Param | Original file | Final file |
|---|---|---|
| Filename | modeM0/AS1T01_055T01_9000000394cztM0_level2.evt | modeM0/AS1T01_055T01_9000000394cztM0_level2_quad_clean.evt |
| Size (bytes) | 3,297,841,920 | 556,931,520 |
| Size | 3.1 GB | 531.1 MB |
| Events in quadrant A | 21,699,703 | 3,433,932 |
| Events in quadrant B | 22,341,570 | 3,471,171 |
| Events in quadrant C | 21,958,011 | 3,436,087 |
| Events in quadrant D | 30,661,454 | 3,258,877 |
| Mode SS | |||
|---|---|---|---|
| Quadrant | BADHDUFLAG | Total packets | Discarded packets |
| A | 0 | 972 | 0 |
| B | 0 | 972 | 0 |
| C | 0 | 972 | 0 |
| D | 0 | 972 | 0 |
| Mode M9 | |||
|---|---|---|---|
| Quadrant | BADHDUFLAG | Total packets | Discarded packets |
| A | 0 | 50 | 0 |
| B | 0 | 50 | 0 |
| C | 0 | 50 | 0 |
| D | 0 | 51 | 0 |
| Mode M0 | |||
|---|---|---|---|
| Quadrant | BADHDUFLAG | Total packets | Discarded packets |
| A | 0 | 98436 | 0 |
| B | 0 | 99277 | 0 |
| C | 0 | 99390 | 0 |
| D | 0 | 123375 | 0 |
| Quadrant | Total seconds | Saturated seconds | Saturation percentage |
|---|---|---|---|
| A | 47622 | 923 | 1.938180% |
| B | 47622 | 954 | 2.003276% |
| C | 47622 | 581 | 1.220024% |
| D | 47622 | 1597 | 3.353492% |
Noise dominated data is calculated using 1-second bins in cleaned event files. If a bin has >2000 counts, and if more than 50% of those come from <1% of pixels, then it is considered to be noise-dominated and hence unusable.
| Quadrant | # 1 sec bins | Bins with >0 counts | Bins with >2000 counts | High rate bins dominated by noise | Noise dominated (total time) | Noise dominated (detector-on time) | Marked lightcurve |
|---|---|---|---|---|---|---|---|
| A | 52133 | 47633 | 2 | 2 | 0.00% | 0.00% |  |
| B | 52133 | 47633 | 15 | 15 | 0.03% | 0.03% | 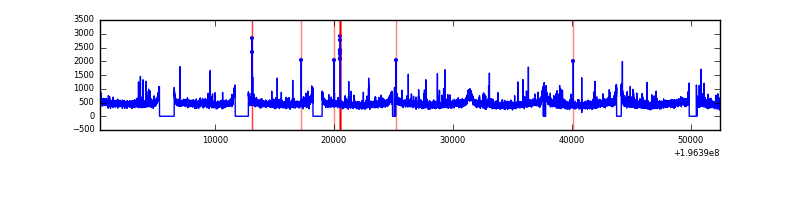 |
| C | 52133 | 47633 | 43 | 43 | 0.08% | 0.09% |  |
| D | 52133 | 47633 | 859 | 859 | 1.65% | 1.80% | 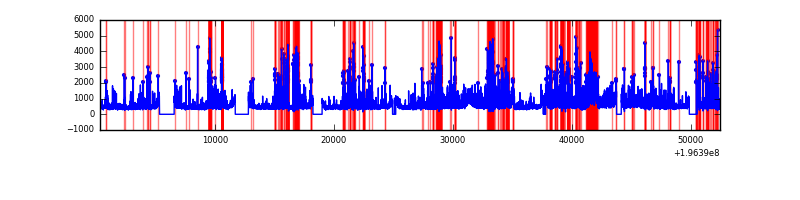 |
Top three noisy pixels from each quadrant. If the there are fewer than three noisy pixels in the level2.evt file, extra rows are filled as -1
| Pixel properties | Quadrant properties | ||||||
|---|---|---|---|---|---|---|---|
| Quadrant | DetID | PixID | Counts | Sigma | Mean | Median | Sigma |
| A | 8 | 15 | 98756 | 81.34 | 5601 | 5469 | 1146.8 |
| A | 12 | 194 | 63201 | 50.34 | 5601 | 5469 | 1146.8 |
| A | 0 | 226 | 60245 | 47.76 | 5601 | 5469 | 1146.8 |
| B | 14 | 167 | 97909 | 84.77 | 5681 | 5537 | 1089.7 |
| B | 15 | 85 | 86521 | 74.32 | 5681 | 5537 | 1089.7 |
| B | 12 | 111 | 78134 | 66.62 | 5681 | 5537 | 1089.7 |
| C | 14 | 223 | 213030 | 163.27 | 5438 | 5461 | 1271.3 |
| C | 9 | 70 | 173631 | 132.28 | 5438 | 5461 | 1271.3 |
| C | 12 | 4 | 110174 | 82.37 | 5438 | 5461 | 1271.3 |
| D | 2 | 255 | 4690001 | 3644.68 | 5365 | 5231 | 1285.4 |
| D | 5 | 172 | 1146611 | 887.97 | 5365 | 5231 | 1285.4 |
| D | 2 | 184 | 813491 | 628.81 | 5365 | 5231 | 1285.4 |
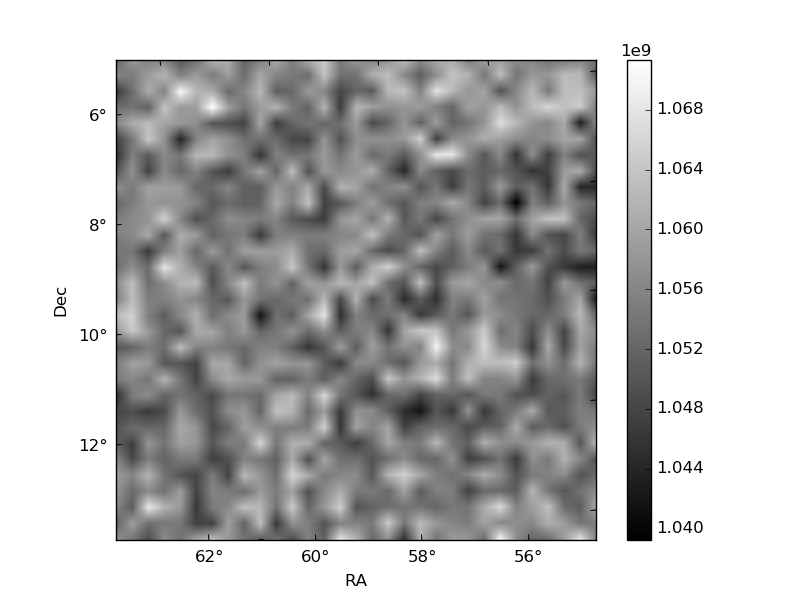
Histogram calculated using DETX and DETY for each event in the final _common_clean file
| Quadrant A |  |
 |
Quadrant B |
|---|---|---|---|
| Quadrant D |  |
 |
Quadrant C |
| Plot type | Count rate plots | Images |
|---|---|---|
| Comparison with Poisson distribution Blue bars denote a histogram of data divided into 1 sec bins. Red curve is a Poisson curve with rate = median count rate of data. |
 |
 |
| Quadrant-wise count rates Data is divided into 100 sec bins |
 |
|
| Module-wise count rates for Quadrant A Data is divided into 100 sec bins |
 |
 |
| Module-wise count rates for Quadrant B Data is divided into 100 sec bins |
 |
 |
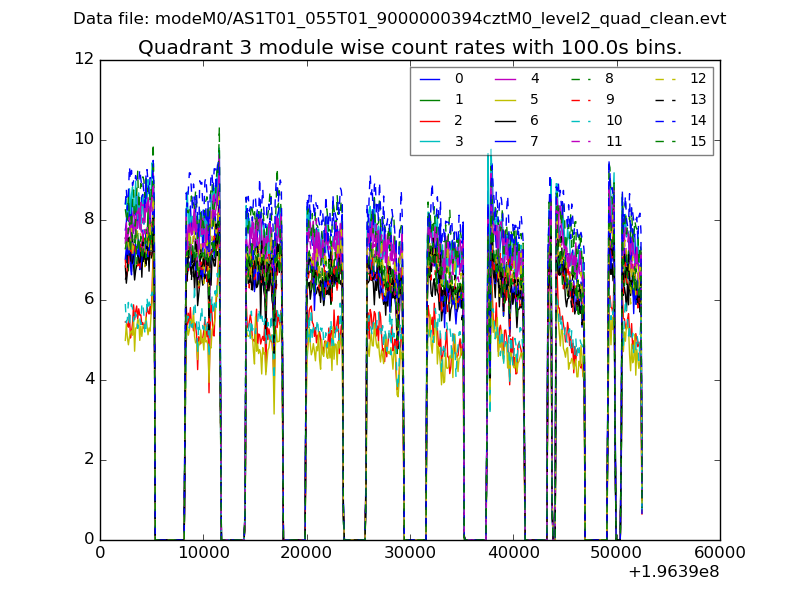
| Module-wise count rates for Quadrant C Data is divided into 100 sec bins |
 |
 |
| Module-wise count rates for Quadrant D Data is divided into 100 sec bins |
 |
 |
| Parameter | Plot |
|---|---|
| CZT HV Monitor |  |
| D_VDD |  |
| Temperature 1 |  |
| Veto HV Monitor |  |
| Veto LLD |  |
| Alpha Counter |  |
| _CPM_Rate | 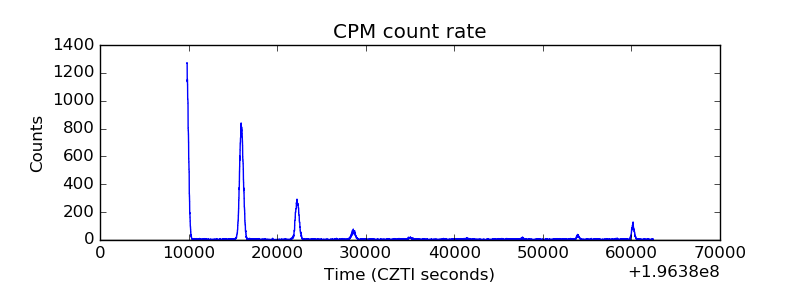 |
| CZT Counter |  |
| +2.5 Volts monitor |  |
| +5 Volts monitor |  |
| _ROLL_ROT |  |
| _Roll_DEC |  |
| _Roll_RA | 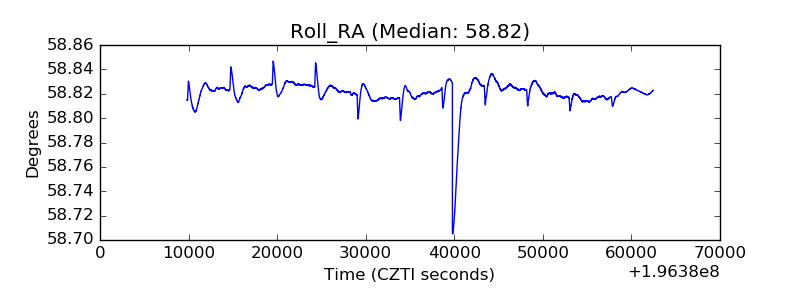 |
| Veto Counter |  |