| Param | Original file | Final file |
|---|---|---|
| Filename | modeM0/AS1T01_046T01_9000000396cztM0_level2.evt | modeM0/AS1T01_046T01_9000000396cztM0_level2_quad_clean.evt |
| Size (bytes) | 5,102,259,840 | 987,125,760 |
| Size | 4.8 GB | 941.4 MB |
| Events in quadrant A | 33,223,824 | 6,117,786 |
| Events in quadrant B | 34,460,040 | 6,303,476 |
| Events in quadrant C | 42,394,052 | 6,262,961 |
| Events in quadrant D | 39,322,761 | 6,013,788 |
| Mode SS | |||
|---|---|---|---|
| Quadrant | BADHDUFLAG | Total packets | Discarded packets |
| A | 0 | 1546 | 0 |
| B | 0 | 1550 | 0 |
| C | 0 | 1538 | 0 |
| D | 0 | 1537 | 0 |
| Mode M9 | |||
|---|---|---|---|
| Quadrant | BADHDUFLAG | Total packets | Discarded packets |
| A | 0 | 132 | 0 |
| B | 0 | 132 | 0 |
| C | 0 | 132 | 0 |
| D | 0 | 132 | 0 |
| Mode M0 | |||
|---|---|---|---|
| Quadrant | BADHDUFLAG | Total packets | Discarded packets |
| A | 0 | 155060 | 0 |
| B | 0 | 156587 | 0 |
| C | 0 | 179509 | 0 |
| D | 0 | 173771 | 0 |
| Quadrant | Total seconds | Saturated seconds | Saturation percentage |
|---|---|---|---|
| A | 75889 | 912 | 1.201755% |
| B | 75874 | 924 | 1.217808% |
| C | 75845 | 1826 | 2.407542% |
| D | 75835 | 1561 | 2.058416% |
Noise dominated data is calculated using 1-second bins in cleaned event files. If a bin has >2000 counts, and if more than 50% of those come from <1% of pixels, then it is considered to be noise-dominated and hence unusable.
| Quadrant | # 1 sec bins | Bins with >0 counts | Bins with >2000 counts | High rate bins dominated by noise | Noise dominated (total time) | Noise dominated (detector-on time) | Marked lightcurve |
|---|---|---|---|---|---|---|---|
| A | 114543 | 76276 | 0 | 0 | 0.00% | 0.00% |  |
| B | 114543 | 76247 | 15 | 15 | 0.01% | 0.02% | 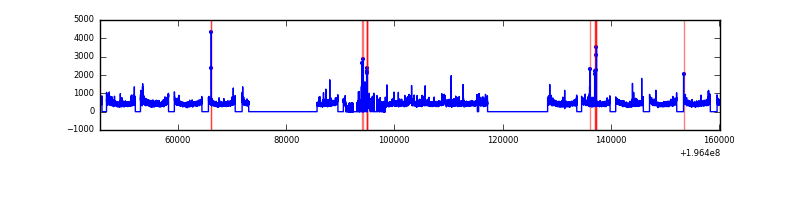 |
| C | 114543 | 76209 | 714 | 714 | 0.62% | 0.94% |  |
| D | 114543 | 76217 | 757 | 757 | 0.66% | 0.99% | 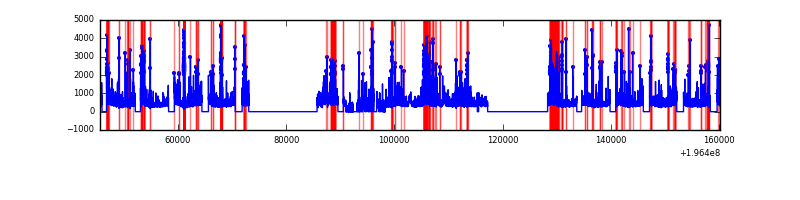 |
Top three noisy pixels from each quadrant. If the there are fewer than three noisy pixels in the level2.evt file, extra rows are filled as -1
| Pixel properties | Quadrant properties | ||||||
|---|---|---|---|---|---|---|---|
| Quadrant | DetID | PixID | Counts | Sigma | Mean | Median | Sigma |
| A | 8 | 15 | 100988 | 53.19 | 8584 | 8370 | 1741.4 |
| A | 12 | 194 | 94980 | 49.74 | 8584 | 8370 | 1741.4 |
| A | 0 | 226 | 91141 | 47.53 | 8584 | 8370 | 1741.4 |
| B | 6 | 36 | 181941 | 105.32 | 8752 | 8523 | 1646.5 |
| B | 10 | 244 | 164601 | 94.79 | 8752 | 8523 | 1646.5 |
| B | 0 | 189 | 133068 | 75.64 | 8752 | 8523 | 1646.5 |
| C | 9 | 70 | 8757702 | 4543.95 | 8382 | 8404 | 1925.5 |
| C | 14 | 223 | 369929 | 187.76 | 8382 | 8404 | 1925.5 |
| C | 12 | 4 | 238210 | 119.35 | 8382 | 8404 | 1925.5 |
| D | 2 | 184 | 2125572 | 1078.15 | 8275 | 8070 | 1964.0 |
| D | 2 | 248 | 1308764 | 662.26 | 8275 | 8070 | 1964.0 |
| D | 12 | 79 | 1163027 | 588.06 | 8275 | 8070 | 1964.0 |
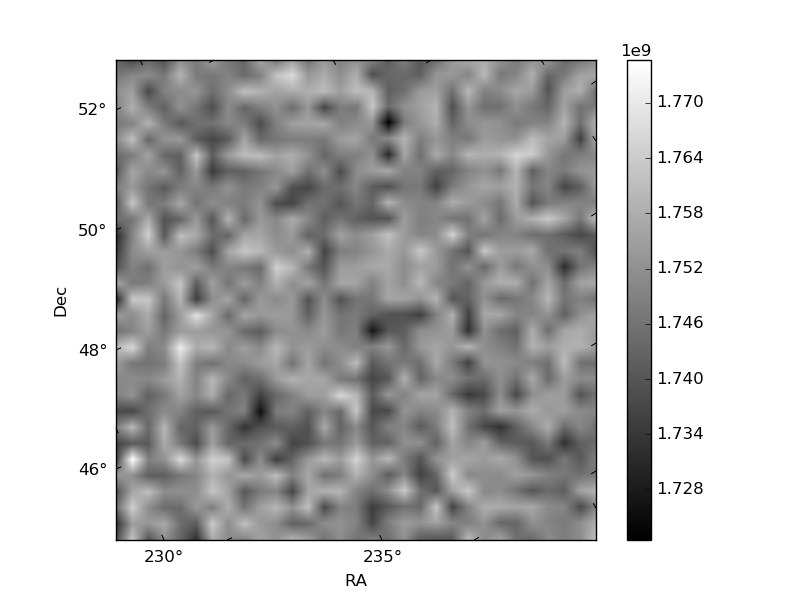
Histogram calculated using DETX and DETY for each event in the final _common_clean file
| Quadrant A |  |
 |
Quadrant B |
|---|---|---|---|
| Quadrant D |  |
 |
Quadrant C |
| Plot type | Count rate plots | Images |
|---|---|---|
| Comparison with Poisson distribution Blue bars denote a histogram of data divided into 1 sec bins. Red curve is a Poisson curve with rate = median count rate of data. |
 |
 |
| Quadrant-wise count rates Data is divided into 100 sec bins |
 |
|
| Module-wise count rates for Quadrant A Data is divided into 100 sec bins |
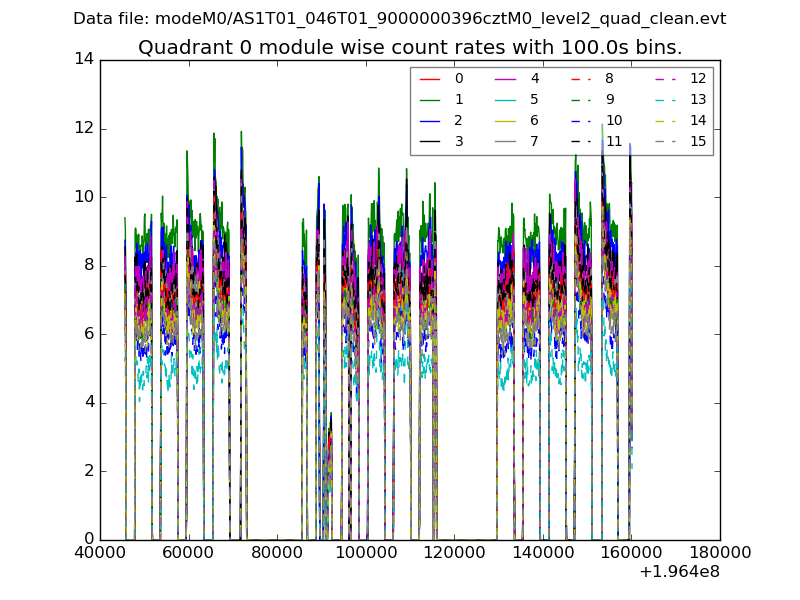 |
 |
| Module-wise count rates for Quadrant B Data is divided into 100 sec bins |
 |
 |
| Module-wise count rates for Quadrant C Data is divided into 100 sec bins |
 |
 |
| Module-wise count rates for Quadrant D Data is divided into 100 sec bins |
 |
 |
| Parameter | Plot |
|---|---|
| CZT HV Monitor |  |
| D_VDD |  |
| Temperature 1 |  |
| Veto HV Monitor |  |
| Veto LLD | 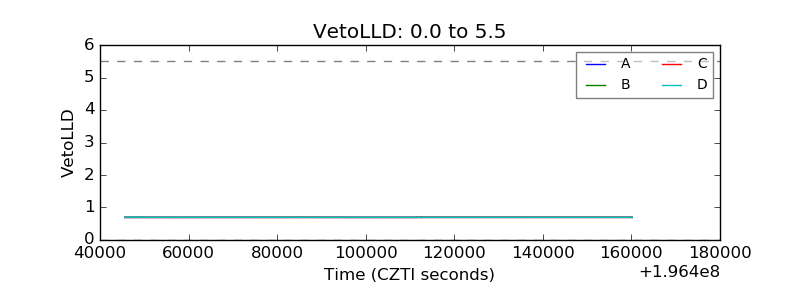 |
| Alpha Counter | 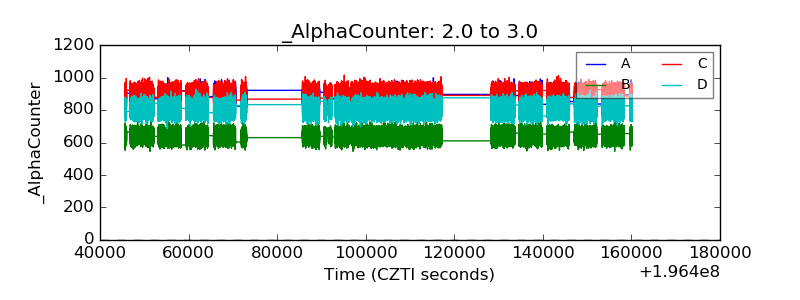 |
| _CPM_Rate |  |
| CZT Counter |  |
| +2.5 Volts monitor |  |
| +5 Volts monitor | 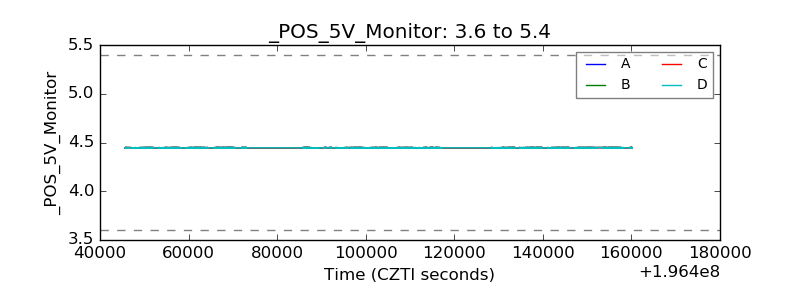 |
| _ROLL_ROT |  |
| _Roll_DEC | 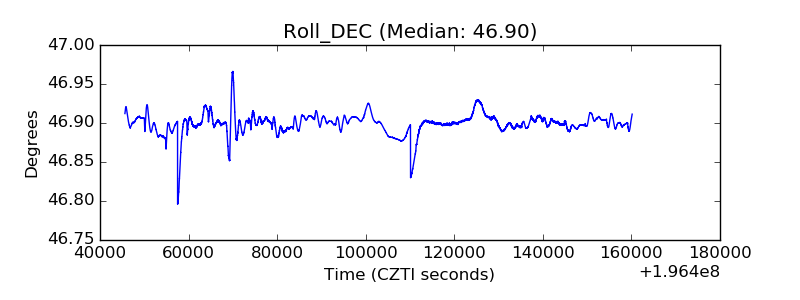 |
| _Roll_RA | 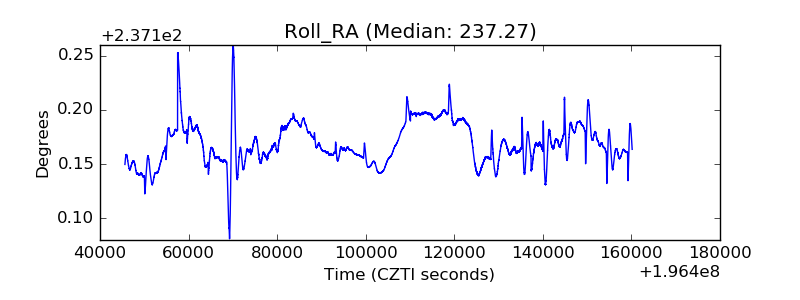 |
| Veto Counter | 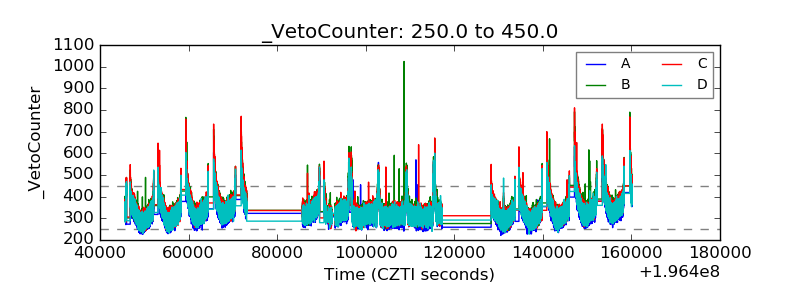 |