| Param | Original file | Final file |
|---|---|---|
| Filename | modeM0/AS1T01_051T01_9000000390cztM0_level2_bc.evt | modeM0/AS1T01_051T01_9000000390cztM0_level2_quad_clean.evt |
| Size (bytes) | 1,296,227,520 | 580,273,920 |
| Size | 1.2 GB | 553.4 MB |
| Events in quadrant A | 6,685,472 | 3,734,148 |
| Events in quadrant B | 7,976,183 | 3,826,598 |
| Events in quadrant C | 8,020,340 | 3,839,610 |
| Events in quadrant D | 14,023,819 | 3,610,563 |
| Mode M0 | |||
|---|---|---|---|
| Quadrant | BADHDUFLAG | Total packets | Discarded packets |
| A | 0 | 76432 | 0 |
| B | 0 | 79902 | 0 |
| C | 0 | 79388 | 0 |
| D | 0 | 99495 | 0 |
| Mode M9 | |||
|---|---|---|---|
| Quadrant | BADHDUFLAG | Total packets | Discarded packets |
| A | 0 | 35 | 0 |
| B | 0 | 35 | 0 |
| C | 0 | 35 | 0 |
| D | 0 | 36 | 0 |
| Mode SS | |||
|---|---|---|---|
| Quadrant | BADHDUFLAG | Total packets | Discarded packets |
| A | 0 | 756 | 0 |
| B | 0 | 756 | 0 |
| C | 0 | 756 | 0 |
| D | 0 | 756 | 0 |
| Quadrant | Total seconds | Saturated seconds | Saturation percentage |
|---|---|---|---|
| A | 37356 | 629 | 1.683799% |
| B | 37356 | 674 | 1.804262% |
| C | 37356 | 455 | 1.218010% |
| D | 37356 | 1797 | 4.810472% |
Noise dominated data is calculated using 1-second bins in cleaned event files. If a bin has >2000 counts, and if more than 50% of those come from <1% of pixels, then it is considered to be noise-dominated and hence unusable.
| Quadrant | # 1 sec bins | Bins with >0 counts | Bins with >2000 counts | High rate bins dominated by noise | Noise dominated (total time) | Noise dominated (detector-on time) | Marked lightcurve |
|---|---|---|---|---|---|---|---|
| A | 40390 | 37357 | 0 | 0 | 0.00% | 0.00% |  |
| B | 40390 | 37358 | 25 | 25 | 0.06% | 0.07% | 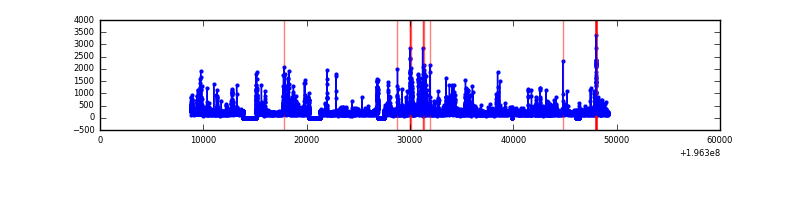 |
| C | 40390 | 37358 | 25 | 25 | 0.06% | 0.07% |  |
| D | 40390 | 37356 | 66 | 66 | 0.16% | 0.18% | 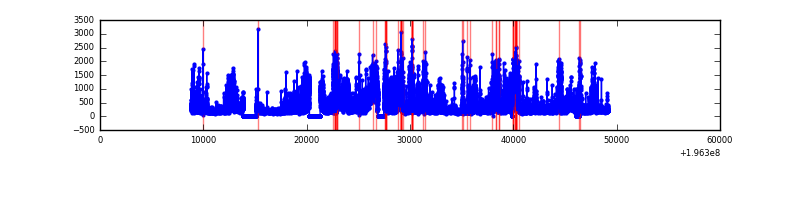 |
Top three noisy pixels from each quadrant. If the there are fewer than three noisy pixels in the level2.evt file, extra rows are filled as -1
| Pixel properties | Quadrant properties | ||||||
|---|---|---|---|---|---|---|---|
| Quadrant | DetID | PixID | Counts | Sigma | Mean | Median | Sigma |
| A | 3 | 1 | 36086 | 90.01 | 1713 | 1670 | 382.3 |
| A | 8 | 15 | 17986 | 42.67 | 1713 | 1670 | 382.3 |
| A | 14 | 238 | 16969 | 40.01 | 1713 | 1670 | 382.3 |
| B | 10 | 244 | 596553 | 1850.12 | 1755 | 1700 | 321.5 |
| B | 5 | 6 | 159536 | 490.9 | 1755 | 1700 | 321.5 |
| B | 0 | 171 | 124986 | 383.44 | 1755 | 1700 | 321.5 |
| C | 2 | 53 | 573758 | 1503.37 | 1724 | 1691 | 380.5 |
| C | 9 | 85 | 340233 | 889.67 | 1724 | 1691 | 380.5 |
| C | 10 | 34 | 137595 | 357.15 | 1724 | 1691 | 380.5 |
| D | 10 | 170 | 2691252 | 6982.31 | 1670 | 1616 | 385.2 |
| D | 2 | 216 | 2539555 | 6588.5 | 1670 | 1616 | 385.2 |
| D | 2 | 184 | 923475 | 2393.15 | 1670 | 1616 | 385.2 |
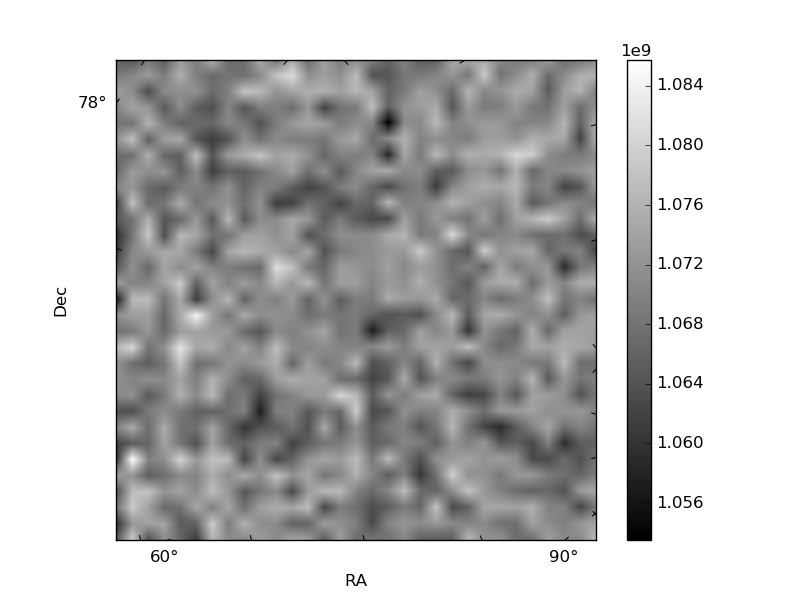
Histogram calculated using DETX and DETY for each event in the final _common_clean file
| Quadrant A | 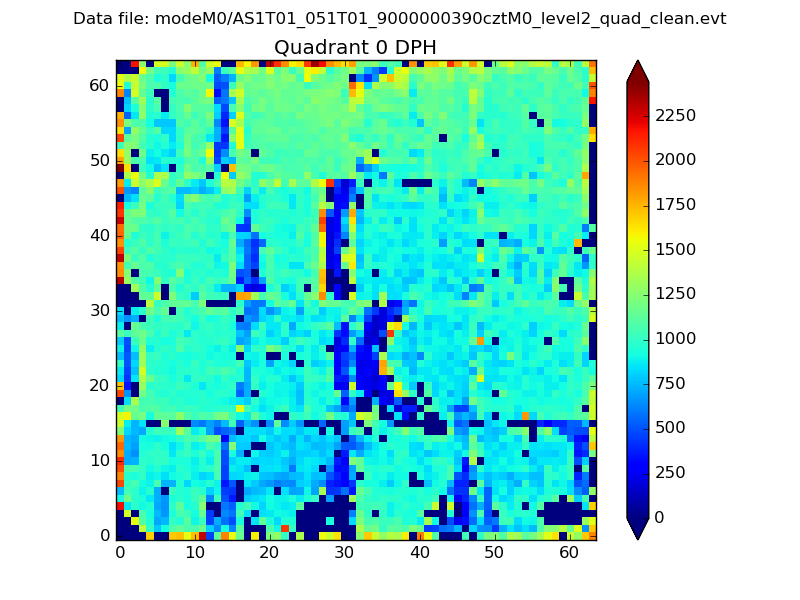 |
 |
Quadrant B |
|---|---|---|---|
| Quadrant D |  |
 |
Quadrant C |
| Plot type | Count rate plots | Images |
|---|---|---|
| Comparison with Poisson distribution Blue bars denote a histogram of data divided into 1 sec bins. Red curve is a Poisson curve with rate = median count rate of data. |
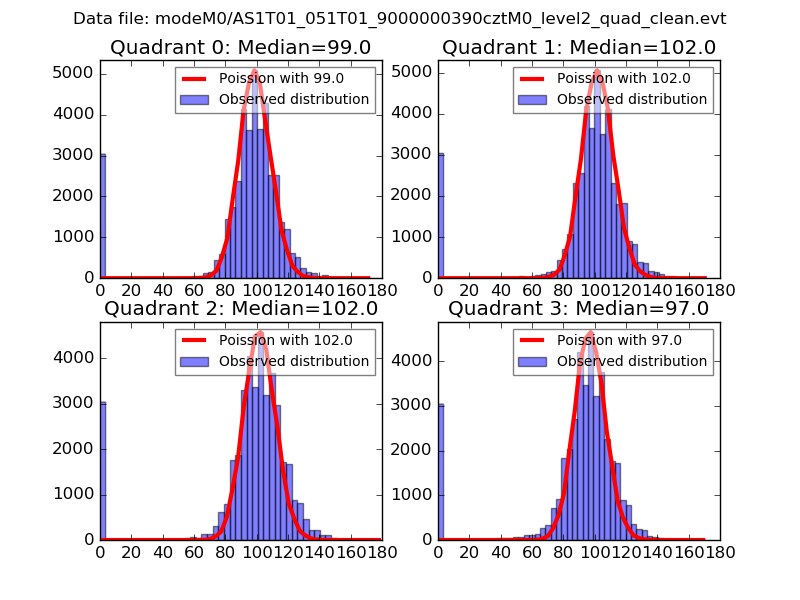 |
 |
| Quadrant-wise count rates Data is divided into 100 sec bins |
 |
|
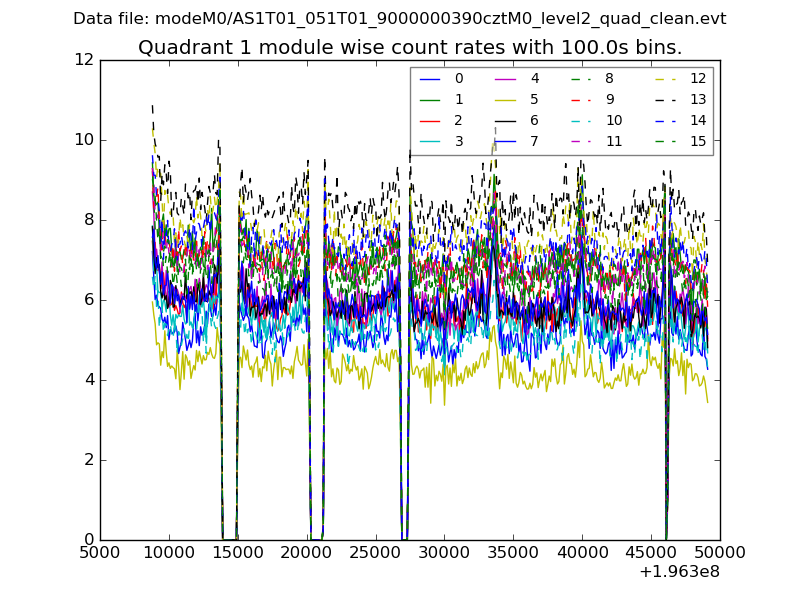
| Module-wise count rates for Quadrant A Data is divided into 100 sec bins |
 |
 |
| Module-wise count rates for Quadrant B Data is divided into 100 sec bins |
 |
 |
| Module-wise count rates for Quadrant C Data is divided into 100 sec bins |
 |
 |
| Module-wise count rates for Quadrant D Data is divided into 100 sec bins |
 |
 |
| Parameter | Plot |
|---|---|
| CZT HV Monitor | 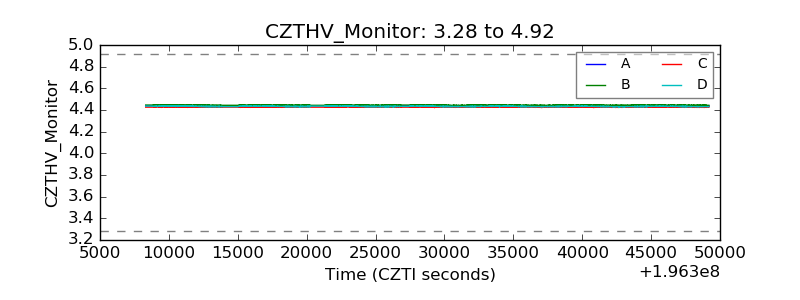 |
| D_VDD |  |
| Temperature 1 | 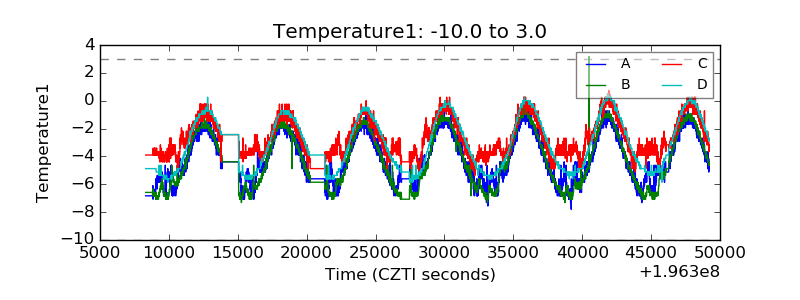 |
| Veto HV Monitor |  |
| Veto LLD | 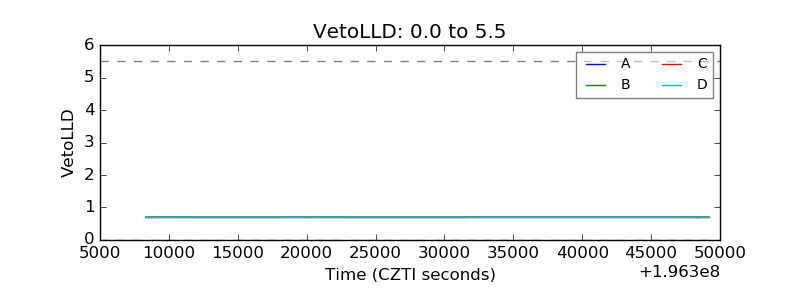 |
| Alpha Counter |  |
| _CPM_Rate | 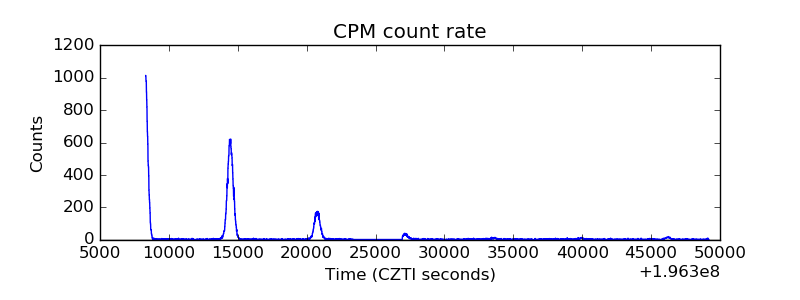 |
| CZT Counter | 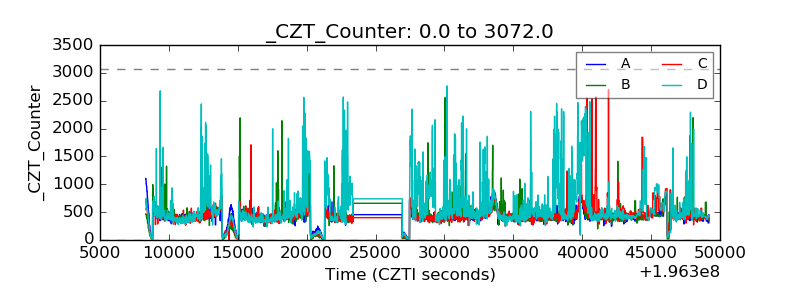 |
| +2.5 Volts monitor |  |
| +5 Volts monitor |  |
| _ROLL_ROT | 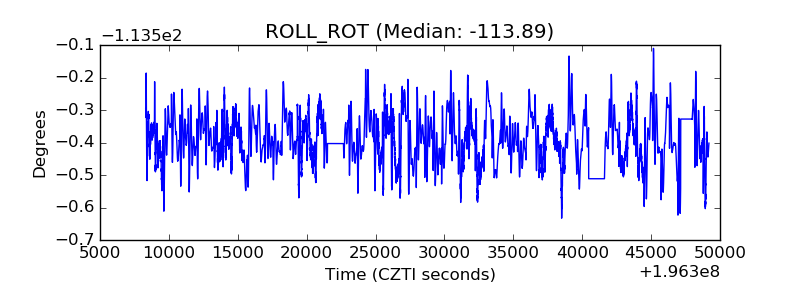 |
| _Roll_DEC |  |
| _Roll_RA |  |
| Veto Counter |  |