| Param | Original file | Final file |
|---|---|---|
| Filename | modeM0/AS1T01_107T01_9000000386cztM0_level2_bc.evt | modeM0/AS1T01_107T01_9000000386cztM0_level2_quad_clean.evt |
| Size (bytes) | 390,182,400 | 153,305,280 |
| Size | 372.1 MB | 146.2 MB |
| Events in quadrant A | 2,457,607 | 940,759 |
| Events in quadrant B | 2,577,322 | 956,919 |
| Events in quadrant C | 3,141,672 | 929,845 |
| Events in quadrant D | 2,731,402 | 902,197 |
| Mode M0 | |||
|---|---|---|---|
| Quadrant | BADHDUFLAG | Total packets | Discarded packets |
| A | 0 | 26793 | 0 |
| B | 0 | 26950 | 0 |
| C | 0 | 28922 | 0 |
| D | 0 | 27528 | 0 |
| Mode SS | |||
|---|---|---|---|
| Quadrant | BADHDUFLAG | Total packets | Discarded packets |
| A | 0 | 268 | 0 |
| B | 0 | 268 | 0 |
| C | 0 | 268 | 0 |
| D | 0 | 268 | 0 |
| Mode M9 | |||
|---|---|---|---|
| Quadrant | BADHDUFLAG | Total packets | Discarded packets |
| A | 0 | 30 | 0 |
| B | 0 | 30 | 0 |
| C | 0 | 30 | 0 |
| D | 0 | 31 | 0 |
| Quadrant | Total seconds | Saturated seconds | Saturation percentage |
|---|---|---|---|
| A | 13224 | 36 | 0.272232% |
| B | 13224 | 40 | 0.302480% |
| C | 13224 | 189 | 1.429220% |
| D | 13224 | 38 | 0.287356% |
Noise dominated data is calculated using 1-second bins in cleaned event files. If a bin has >2000 counts, and if more than 50% of those come from <1% of pixels, then it is considered to be noise-dominated and hence unusable.
| Quadrant | # 1 sec bins | Bins with >0 counts | Bins with >2000 counts | High rate bins dominated by noise | Noise dominated (total time) | Noise dominated (detector-on time) | Marked lightcurve |
|---|---|---|---|---|---|---|---|
| A | 15449 | 13224 | 3 | 3 | 0.02% | 0.02% |  |
| B | 15449 | 13224 | 0 | 0 | 0.00% | 0.00% |  |
| C | 15448 | 13224 | 81 | 81 | 0.52% | 0.61% |  |
| D | 15448 | 13223 | 3 | 3 | 0.02% | 0.02% |  |
Top three noisy pixels from each quadrant. If the there are fewer than three noisy pixels in the level2.evt file, extra rows are filled as -1
| Pixel properties | Quadrant properties | ||||||
|---|---|---|---|---|---|---|---|
| Quadrant | DetID | PixID | Counts | Sigma | Mean | Median | Sigma |
| A | 0 | 149 | 28818 | 200.86 | 626 | 609 | 140.4 |
| A | 0 | 226 | 7607 | 49.83 | 626 | 609 | 140.4 |
| A | 3 | 1 | 7581 | 49.64 | 626 | 609 | 140.4 |
| B | 0 | 189 | 44909 | 377.98 | 637 | 617 | 117.2 |
| B | 6 | 36 | 37979 | 318.84 | 637 | 617 | 117.2 |
| B | 10 | 244 | 14010 | 114.29 | 637 | 617 | 117.2 |
| C | 2 | 53 | 568324 | 4221.06 | 606 | 596 | 134.5 |
| C | 9 | 70 | 167715 | 1242.53 | 606 | 596 | 134.5 |
| C | 12 | 4 | 13006 | 92.27 | 606 | 596 | 134.5 |
| D | 2 | 136 | 101035 | 710.53 | 603 | 582 | 141.4 |
| D | 2 | 54 | 82868 | 582.03 | 603 | 582 | 141.4 |
| D | 5 | 172 | 49578 | 346.56 | 603 | 582 | 141.4 |
Histogram calculated using DETX and DETY for each event in the final _common_clean file
| Quadrant A |  |
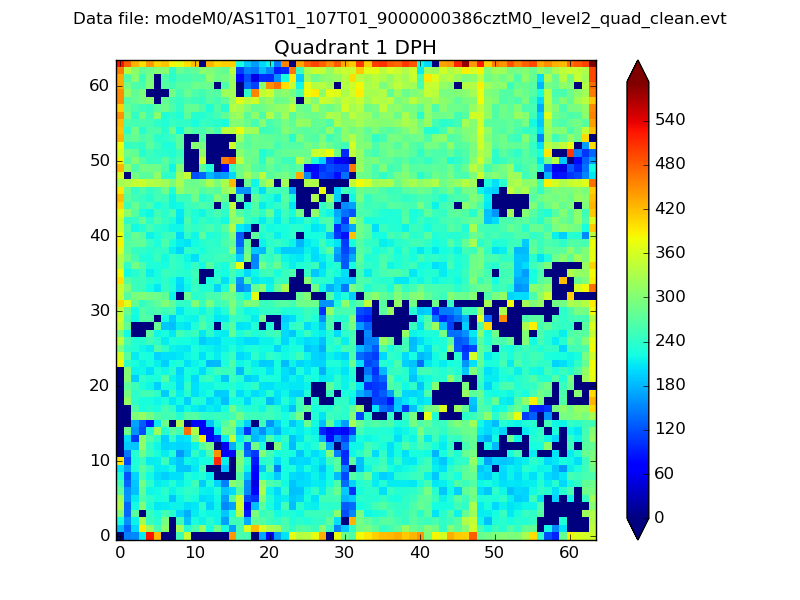 |
Quadrant B |
|---|---|---|---|
| Quadrant D |  |
 |
Quadrant C |
| Plot type | Count rate plots | Images |
|---|---|---|
| Comparison with Poisson distribution Blue bars denote a histogram of data divided into 1 sec bins. Red curve is a Poisson curve with rate = median count rate of data. |
 |
 |
| Quadrant-wise count rates Data is divided into 100 sec bins |
 |
|
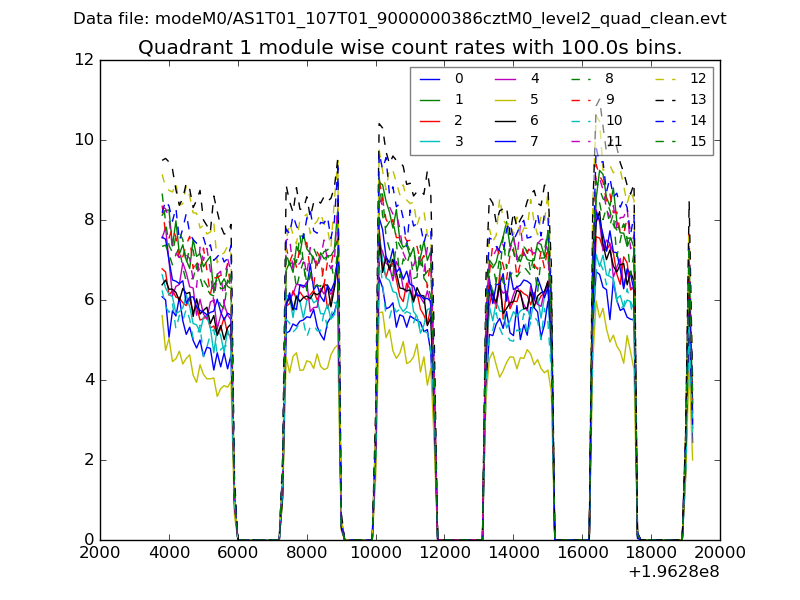
| Module-wise count rates for Quadrant A Data is divided into 100 sec bins |
 |
 |
| Module-wise count rates for Quadrant B Data is divided into 100 sec bins |
 |
 |
| Module-wise count rates for Quadrant C Data is divided into 100 sec bins |
 |
 |
| Module-wise count rates for Quadrant D Data is divided into 100 sec bins |
 |
 |
| Parameter | Plot |
|---|---|
| CZT HV Monitor |  |
| D_VDD | 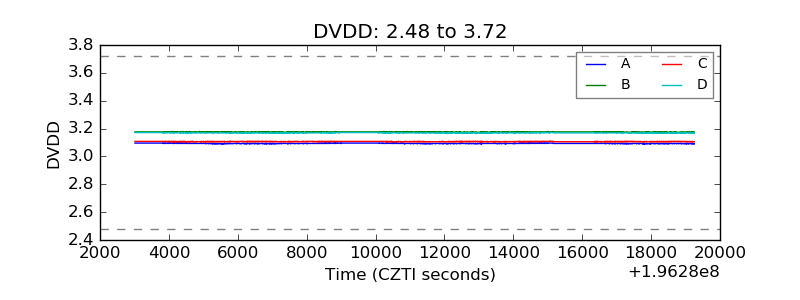 |
| Temperature 1 |  |
| Veto HV Monitor |  |
| Veto LLD |  |
| Alpha Counter | 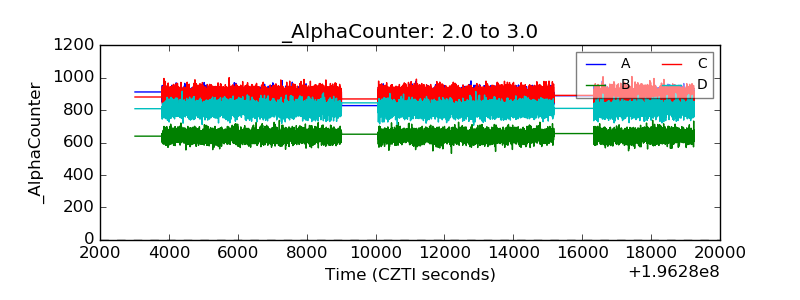 |
| _CPM_Rate |  |
| CZT Counter |  |
| +2.5 Volts monitor |  |
| +5 Volts monitor |  |
| _ROLL_ROT | 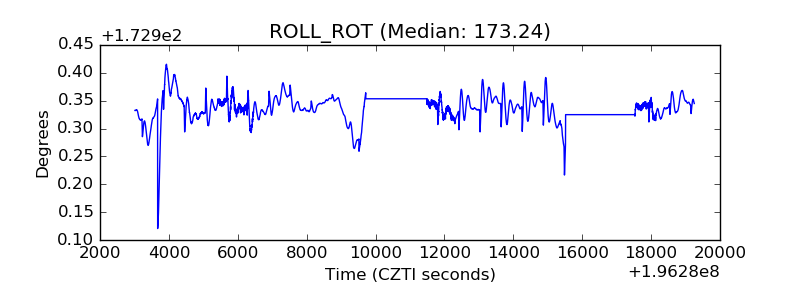 |
| _Roll_DEC |  |
| _Roll_RA |  |
| Veto Counter | 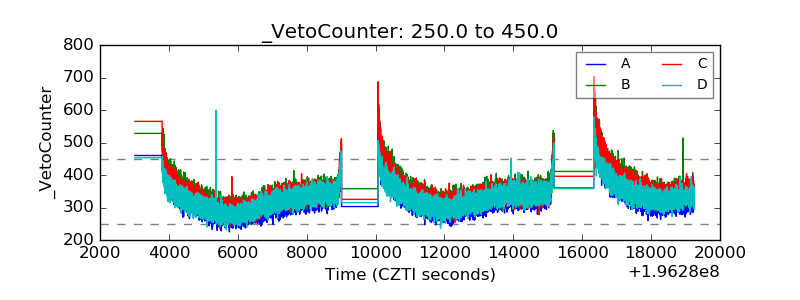 |