| Param | Original file | Final file |
|---|---|---|
| Filename | modeM0/AS1P01_010T01_9000000388cztM0_level2_bc.evt | modeM0/AS1P01_010T01_9000000388cztM0_level2_quad_clean.evt |
| Size (bytes) | 83,684,160 | 46,704,960 |
| Size | 79.8 MB | 44.5 MB |
| Events in quadrant A | 584,978 | 310,455 |
| Events in quadrant B | 572,953 | 317,724 |
| Events in quadrant C | 634,886 | 300,904 |
| Events in quadrant D | 549,829 | 292,506 |
| Mode M0 | |||
|---|---|---|---|
| Quadrant | BADHDUFLAG | Total packets | Discarded packets |
| A | 0 | 5542 | 1 |
| B | 0 | 5518 | 1 |
| C | 0 | 5844 | 1 |
| D | 0 | 5497 | 1 |
| Mode SS | |||
|---|---|---|---|
| Quadrant | BADHDUFLAG | Total packets | Discarded packets |
| A | 0 | 54 | 0 |
| B | 0 | 54 | 0 |
| C | 0 | 54 | 0 |
| D | 0 | 54 | 0 |
| Mode M9 | |||
|---|---|---|---|
| Quadrant | BADHDUFLAG | Total packets | Discarded packets |
| A | 0 | 4 | 0 |
| B | 0 | 4 | 0 |
| C | 0 | 4 | 0 |
| D | 0 | 5 | 0 |
| Quadrant | Total seconds | Saturated seconds | Saturation percentage |
|---|---|---|---|
| A | 2690 | 6 | 0.223048% |
| B | 2690 | 6 | 0.223048% |
| C | 2690 | 7 | 0.260223% |
| D | 2690 | 3 | 0.111524% |
Noise dominated data is calculated using 1-second bins in cleaned event files. If a bin has >2000 counts, and if more than 50% of those come from <1% of pixels, then it is considered to be noise-dominated and hence unusable.
| Quadrant | # 1 sec bins | Bins with >0 counts | Bins with >2000 counts | High rate bins dominated by noise | Noise dominated (total time) | Noise dominated (detector-on time) | Marked lightcurve |
|---|---|---|---|---|---|---|---|
| A | 2689 | 2689 | 0 | 0 | 0.00% | 0.00% |  |
| B | 2689 | 2689 | 1 | 1 | 0.04% | 0.04% | 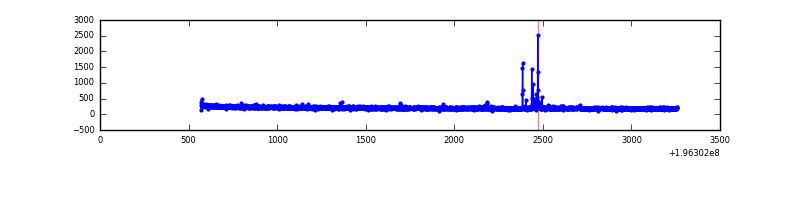 |
| C | 2689 | 2689 | 0 | 0 | 0.00% | 0.00% |  |
| D | 2689 | 2689 | 0 | 0 | 0.00% | 0.00% |  |
Top three noisy pixels from each quadrant. If the there are fewer than three noisy pixels in the level2.evt file, extra rows are filled as -1
| Pixel properties | Quadrant properties | ||||||
|---|---|---|---|---|---|---|---|
| Quadrant | DetID | PixID | Counts | Sigma | Mean | Median | Sigma |
| A | 3 | 1 | 42170 | 1331.75 | 140 | 137 | 31.6 |
| A | 12 | 194 | 1279 | 36.18 | 140 | 137 | 31.6 |
| A | 0 | 226 | 1138 | 31.72 | 140 | 137 | 31.6 |
| B | 10 | 244 | 16761 | 602.18 | 143 | 139 | 27.6 |
| B | 0 | 189 | 8241 | 293.52 | 143 | 139 | 27.6 |
| B | 8 | 61 | 1201 | 38.47 | 143 | 139 | 27.6 |
| C | 2 | 53 | 75895 | 2440.78 | 136 | 134 | 31.0 |
| C | 10 | 82 | 16024 | 511.93 | 136 | 134 | 31.0 |
| C | 10 | 34 | 4545 | 142.11 | 136 | 134 | 31.0 |
| D | 2 | 14 | 14991 | 463.76 | 134 | 131 | 32.0 |
| D | 7 | 67 | 7759 | 238.06 | 134 | 131 | 32.0 |
| D | 2 | 184 | 4700 | 142.59 | 134 | 131 | 32.0 |
Histogram calculated using DETX and DETY for each event in the final _common_clean file
| Quadrant A |  |
 |
Quadrant B |
|---|---|---|---|
| Quadrant D | 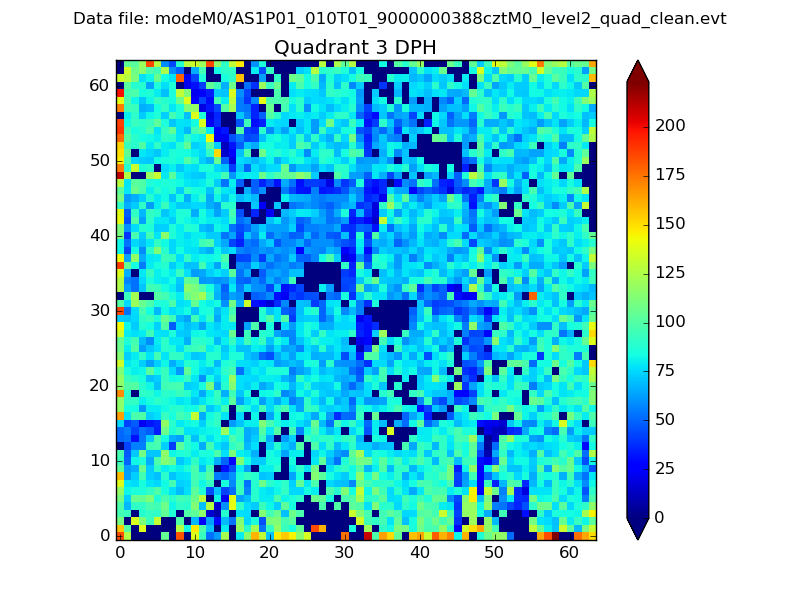 |
 |
Quadrant C |
| Plot type | Count rate plots | Images |
|---|---|---|
| Comparison with Poisson distribution Blue bars denote a histogram of data divided into 1 sec bins. Red curve is a Poisson curve with rate = median count rate of data. |
 |
 |
| Quadrant-wise count rates Data is divided into 100 sec bins |
 |
|
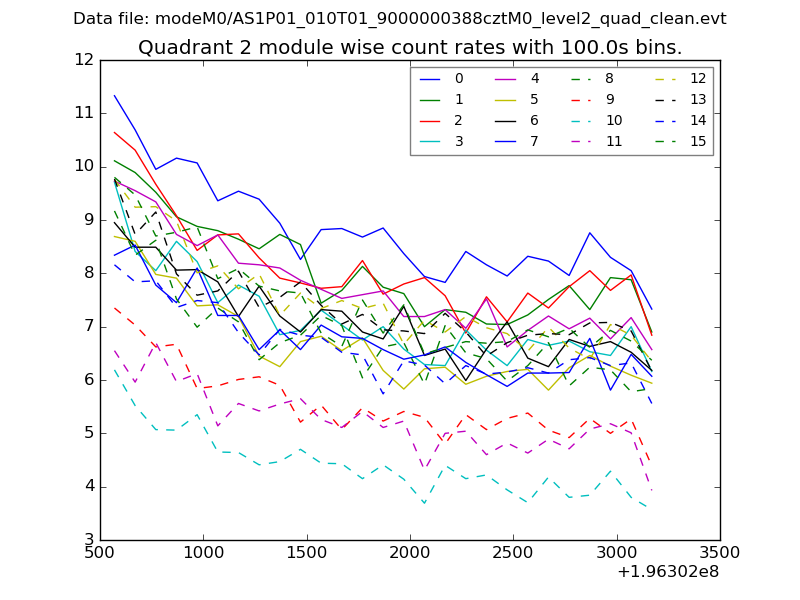
| Module-wise count rates for Quadrant A Data is divided into 100 sec bins |
 |
 |
| Module-wise count rates for Quadrant B Data is divided into 100 sec bins |
 |
 |
| Module-wise count rates for Quadrant C Data is divided into 100 sec bins |
 |
 |
| Module-wise count rates for Quadrant D Data is divided into 100 sec bins |
 |
 |
| Parameter | Plot |
|---|---|
| CZT HV Monitor |  |
| D_VDD |  |
| Temperature 1 | 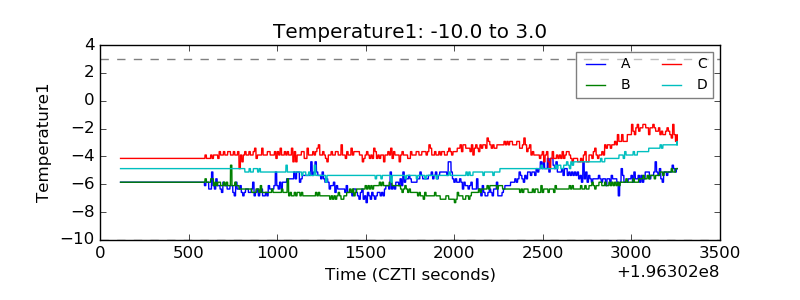 |
| Veto HV Monitor |  |
| Veto LLD |  |
| Alpha Counter |  |
| _CPM_Rate |  |
| CZT Counter |  |
| +2.5 Volts monitor |  |
| +5 Volts monitor |  |
| _ROLL_ROT | 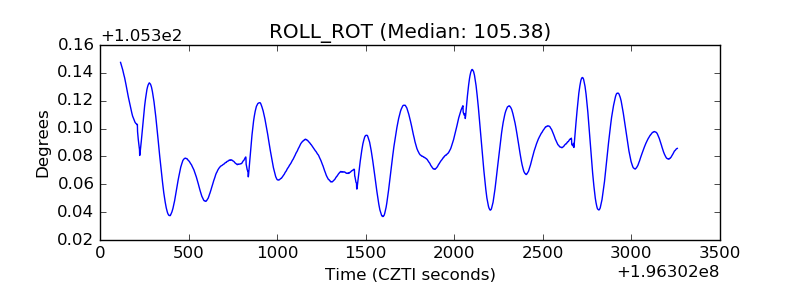 |
| _Roll_DEC | 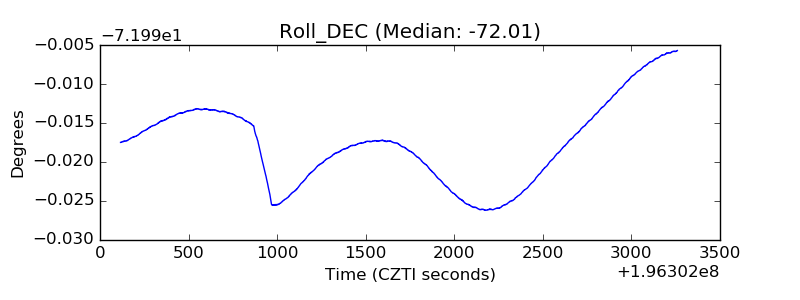 |
| _Roll_RA |  |
| Veto Counter | 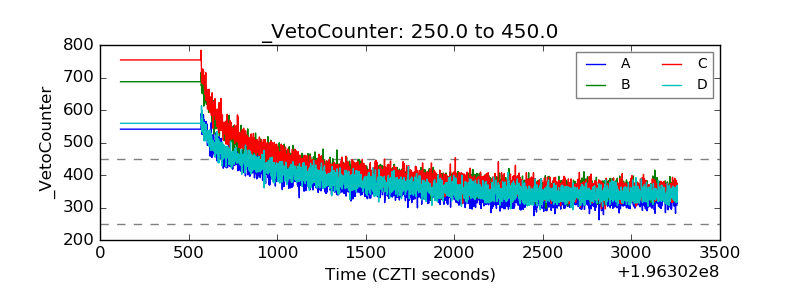 |