| Param | Original file | Final file |
|---|---|---|
| Filename | modeM0/AS1T01_071T01_9000000382cztM0_level2.evt | modeM0/AS1T01_071T01_9000000382cztM0_level2_quad_clean.evt |
| Size (bytes) | 11,314,454,400 | 2,011,086,720 |
| Size | 10.5 GB | 1.9 GB |
| Events in quadrant A | 77,642,982 | 12,290,463 |
| Events in quadrant B | 80,252,569 | 12,570,091 |
| Events in quadrant C | 79,852,380 | 12,435,289 |
| Events in quadrant D | 93,383,862 | 11,918,216 |
| Mode M9 | |||
|---|---|---|---|
| Quadrant | BADHDUFLAG | Total packets | Discarded packets |
| A | 0 | 219 | 0 |
| B | 0 | 219 | 0 |
| C | 0 | 219 | 0 |
| D | 0 | 219 | 0 |
| Mode SS | |||
|---|---|---|---|
| Quadrant | BADHDUFLAG | Total packets | Discarded packets |
| A | 0 | 3472 | 0 |
| B | 0 | 3472 | 0 |
| C | 0 | 3472 | 0 |
| D | 0 | 3472 | 0 |
| Mode M0 | |||
|---|---|---|---|
| Quadrant | BADHDUFLAG | Total packets | Discarded packets |
| A | 0 | 353142 | 0 |
| B | 0 | 356971 | 0 |
| C | 0 | 360596 | 0 |
| D | 0 | 397888 | 0 |
| Quadrant | Total seconds | Saturated seconds | Saturation percentage |
|---|---|---|---|
| A | 170806 | 2420 | 1.416812% |
| B | 170806 | 2511 | 1.470089% |
| C | 170806 | 2397 | 1.403346% |
| D | 170806 | 3534 | 2.069014% |
Noise dominated data is calculated using 1-second bins in cleaned event files. If a bin has >2000 counts, and if more than 50% of those come from <1% of pixels, then it is considered to be noise-dominated and hence unusable.
| Quadrant | # 1 sec bins | Bins with >0 counts | Bins with >2000 counts | High rate bins dominated by noise | Noise dominated (total time) | Noise dominated (detector-on time) | Marked lightcurve |
|---|---|---|---|---|---|---|---|
| A | 192588 | 170841 | 65 | 65 | 0.03% | 0.04% |  |
| B | 192588 | 170841 | 146 | 146 | 0.08% | 0.09% |  |
| C | 192588 | 170841 | 485 | 485 | 0.25% | 0.28% |  |
| D | 192588 | 170841 | 1556 | 1556 | 0.81% | 0.91% |  |
Top three noisy pixels from each quadrant. If the there are fewer than three noisy pixels in the level2.evt file, extra rows are filled as -1
| Pixel properties | Quadrant properties | ||||||
|---|---|---|---|---|---|---|---|
| Quadrant | DetID | PixID | Counts | Sigma | Mean | Median | Sigma |
| A | 14 | 238 | 1061874 | 260.65 | 19731 | 19265 | 4000.0 |
| A | 3 | 1 | 441313 | 105.51 | 19731 | 19265 | 4000.0 |
| A | 12 | 194 | 220352 | 50.27 | 19731 | 19265 | 4000.0 |
| B | 10 | 244 | 785002 | 201.48 | 20051 | 19532 | 3799.2 |
| B | 4 | 48 | 399825 | 100.1 | 20051 | 19532 | 3799.2 |
| B | 15 | 85 | 367960 | 91.71 | 20051 | 19532 | 3799.2 |
| C | 9 | 144 | 1295008 | 288.86 | 19131 | 19191 | 4416.7 |
| C | 9 | 70 | 1011210 | 224.61 | 19131 | 19191 | 4416.7 |
| C | 12 | 254 | 776496 | 171.46 | 19131 | 19191 | 4416.7 |
| D | 2 | 184 | 5915040 | 1304.88 | 18936 | 18402 | 4518.9 |
| D | 2 | 255 | 5236189 | 1154.66 | 18936 | 18402 | 4518.9 |
| D | 2 | 54 | 1541392 | 337.03 | 18936 | 18402 | 4518.9 |
Histogram calculated using DETX and DETY for each event in the final _common_clean file
| Quadrant A |  |
 |
Quadrant B |
|---|---|---|---|
| Quadrant D | 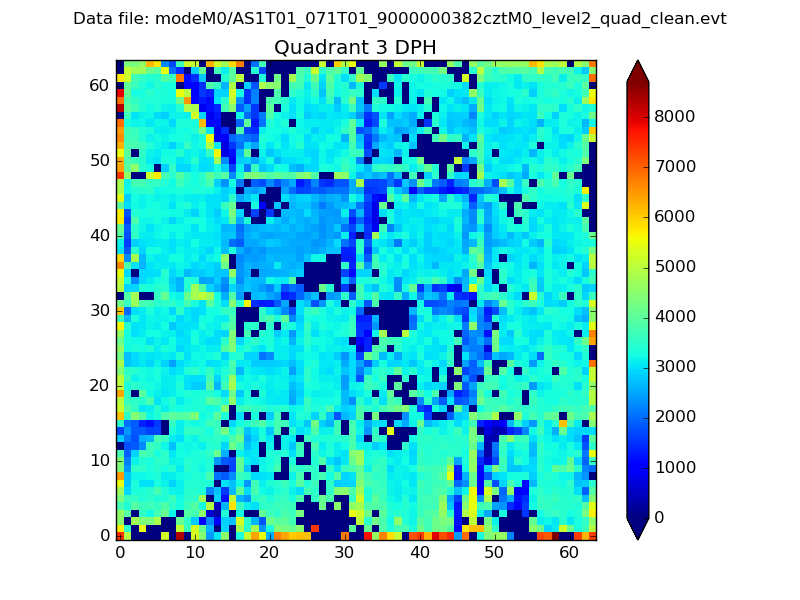 |
 |
Quadrant C |
| Plot type | Count rate plots | Images |
|---|---|---|
| Comparison with Poisson distribution Blue bars denote a histogram of data divided into 1 sec bins. Red curve is a Poisson curve with rate = median count rate of data. |
 |
 |
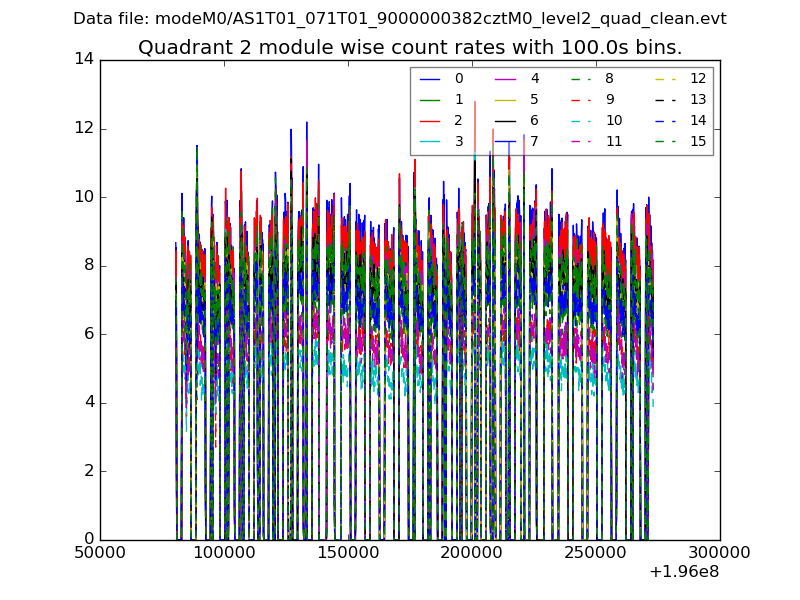
| Quadrant-wise count rates Data is divided into 100 sec bins |
 |
|
| Module-wise count rates for Quadrant A Data is divided into 100 sec bins |
 |
 |
| Module-wise count rates for Quadrant B Data is divided into 100 sec bins |
 |
 |
| Module-wise count rates for Quadrant C Data is divided into 100 sec bins |
 |
 |
| Module-wise count rates for Quadrant D Data is divided into 100 sec bins |
 |
 |
| Parameter | Plot |
|---|---|
| CZT HV Monitor |  |
| D_VDD |  |
| Temperature 1 |  |
| Veto HV Monitor | 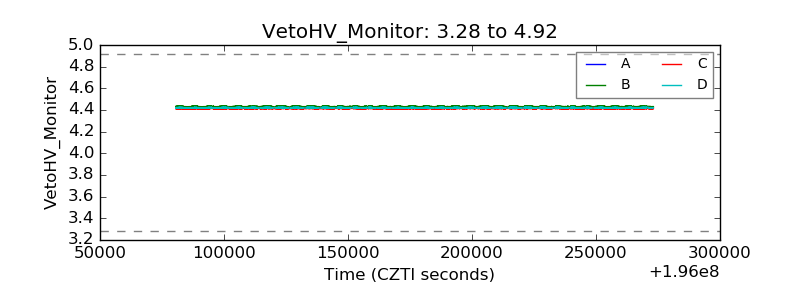 |
| Veto LLD |  |
| Alpha Counter |  |
| _CPM_Rate |  |
| CZT Counter |  |
| +2.5 Volts monitor |  |
| +5 Volts monitor |  |
| _ROLL_ROT |  |
| _Roll_DEC |  |
| _Roll_RA |  |
| Veto Counter |  |