| Param | Original file | Final file |
|---|---|---|
| Filename | modeM0/AS1T01_057T01_9000000380cztM0_level2_bc.evt | modeM0/AS1T01_057T01_9000000380cztM0_level2_quad_clean.evt |
| Size (bytes) | 4,543,384,320 | 1,646,651,520 |
| Size | 4.2 GB | 1.5 GB |
| Events in quadrant A | 27,319,153 | 10,197,015 |
| Events in quadrant B | 30,725,546 | 10,304,707 |
| Events in quadrant C | 33,450,880 | 10,069,096 |
| Events in quadrant D | 36,573,948 | 9,725,467 |
| Mode M0 | |||
|---|---|---|---|
| Quadrant | BADHDUFLAG | Total packets | Discarded packets |
| A | 0 | 290005 | 0 |
| B | 0 | 300967 | 0 |
| C | 0 | 310279 | 0 |
| D | 0 | 325611 | 0 |
| Mode SS | |||
|---|---|---|---|
| Quadrant | BADHDUFLAG | Total packets | Discarded packets |
| A | 0 | 2852 | 0 |
| B | 0 | 2852 | 0 |
| C | 0 | 2852 | 0 |
| D | 0 | 2852 | 0 |
| Mode M9 | |||
|---|---|---|---|
| Quadrant | BADHDUFLAG | Total packets | Discarded packets |
| A | 0 | 204 | 0 |
| B | 0 | 204 | 0 |
| C | 0 | 204 | 0 |
| D | 0 | 204 | 0 |
| Quadrant | Total seconds | Saturated seconds | Saturation percentage |
|---|---|---|---|
| A | 139804 | 1826 | 1.306114% |
| B | 139803 | 2560 | 1.831148% |
| C | 139803 | 2618 | 1.872635% |
| D | 139767 | 3411 | 2.440490% |
Noise dominated data is calculated using 1-second bins in cleaned event files. If a bin has >2000 counts, and if more than 50% of those come from <1% of pixels, then it is considered to be noise-dominated and hence unusable.
| Quadrant | # 1 sec bins | Bins with >0 counts | Bins with >2000 counts | High rate bins dominated by noise | Noise dominated (total time) | Noise dominated (detector-on time) | Marked lightcurve |
|---|---|---|---|---|---|---|---|
| A | 165651 | 139813 | 5 | 5 | 0.00% | 0.00% |  |
| B | 165651 | 139809 | 376 | 376 | 0.23% | 0.27% | 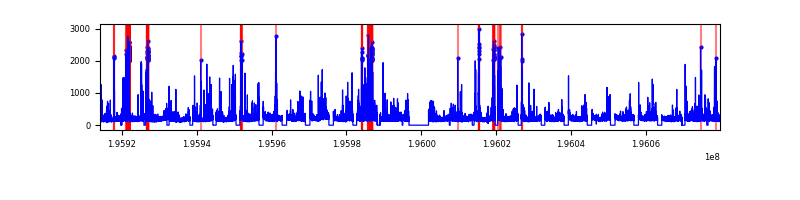 |
| C | 165651 | 139810 | 370 | 370 | 0.22% | 0.26% |  |
| D | 165651 | 139774 | 155 | 155 | 0.09% | 0.11% |  |
Top three noisy pixels from each quadrant. If the there are fewer than three noisy pixels in the level2.evt file, extra rows are filled as -1
| Pixel properties | Quadrant properties | ||||||
|---|---|---|---|---|---|---|---|
| Quadrant | DetID | PixID | Counts | Sigma | Mean | Median | Sigma |
| A | 14 | 238 | 943071 | 646.41 | 6611 | 6440 | 1449.0 |
| A | 8 | 15 | 231430 | 155.27 | 6611 | 6440 | 1449.0 |
| A | 13 | 246 | 161372 | 106.92 | 6611 | 6440 | 1449.0 |
| B | 15 | 85 | 1531528 | 1274.17 | 6687 | 6466 | 1196.9 |
| B | 5 | 6 | 1007379 | 836.25 | 6687 | 6466 | 1196.9 |
| B | 0 | 207 | 639393 | 528.8 | 6687 | 6466 | 1196.9 |
| C | 9 | 144 | 4912293 | 3511.9 | 6449 | 6317 | 1397.0 |
| C | 9 | 70 | 1196194 | 851.76 | 6449 | 6317 | 1397.0 |
| C | 0 | 207 | 827512 | 587.85 | 6449 | 6317 | 1397.0 |
| D | 2 | 184 | 3600115 | 2420.25 | 6415 | 6178 | 1484.9 |
| D | 5 | 233 | 3296960 | 2216.1 | 6415 | 6178 | 1484.9 |
| D | 2 | 136 | 1588014 | 1065.25 | 6415 | 6178 | 1484.9 |
Histogram calculated using DETX and DETY for each event in the final _common_clean file
| Quadrant A |  |
 |
Quadrant B |
|---|---|---|---|
| Quadrant D |  |
 |
Quadrant C |
| Plot type | Count rate plots | Images |
|---|---|---|
| Comparison with Poisson distribution Blue bars denote a histogram of data divided into 1 sec bins. Red curve is a Poisson curve with rate = median count rate of data. |
 |
 |
| Quadrant-wise count rates Data is divided into 100 sec bins |
 |
|
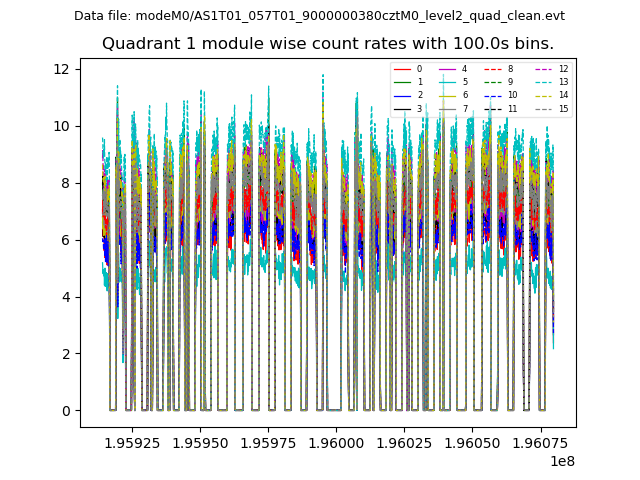
| Module-wise count rates for Quadrant A Data is divided into 100 sec bins |
 |
 |
| Module-wise count rates for Quadrant B Data is divided into 100 sec bins |
 |
 |
| Module-wise count rates for Quadrant C Data is divided into 100 sec bins |
 |
 |
| Module-wise count rates for Quadrant D Data is divided into 100 sec bins |
 |
 |
| Parameter | Plot |
|---|---|
| CZT HV Monitor |  |
| D_VDD |  |
| Temperature 1 |  |
| Veto HV Monitor |  |
| Veto LLD |  |
| Alpha Counter |  |
| _CPM_Rate |  |
| CZT Counter |  |
| +2.5 Volts monitor |  |
| +5 Volts monitor |  |
| _ROLL_ROT |  |
| _Roll_DEC |  |
| _Roll_RA |  |
| Veto Counter |  |