| Param | Original file | Final file |
|---|---|---|
| Filename | modeM0/AS1T01_051T01_9000000376cztM0_level2.evt | modeM0/AS1T01_051T01_9000000376cztM0_level2_quad_clean.evt |
| Size (bytes) | 425,894,400 | 84,222,720 |
| Size | 406.2 MB | 80.3 MB |
| Events in quadrant A | 2,532,056 | 527,630 |
| Events in quadrant B | 2,591,465 | 544,612 |
| Events in quadrant C | 2,686,647 | 555,275 |
| Events in quadrant D | 4,680,146 | 504,146 |
| Mode SS | |||
|---|---|---|---|
| Quadrant | BADHDUFLAG | Total packets | Discarded packets |
| A | 0 | 122 | 0 |
| B | 0 | 122 | 0 |
| C | 0 | 122 | 0 |
| D | 0 | 122 | 0 |
| Mode M0 | |||
|---|---|---|---|
| Quadrant | BADHDUFLAG | Total packets | Discarded packets |
| A | 0 | 12086 | 0 |
| B | 0 | 12146 | 0 |
| C | 0 | 12173 | 0 |
| D | 0 | 18276 | 0 |
| Mode M9 | |||
|---|---|---|---|
| Quadrant | BADHDUFLAG | Total packets | Discarded packets |
| A | 0 | 8 | 0 |
| B | 0 | 8 | 0 |
| C | 0 | 8 | 0 |
| D | 0 | 8 | 0 |
| Quadrant | Total seconds | Saturated seconds | Saturation percentage |
|---|---|---|---|
| A | 5995 | 9 | 0.150125% |
| B | 5995 | 10 | 0.166806% |
| C | 5995 | 13 | 0.216847% |
| D | 5995 | 616 | 10.275229% |
Noise dominated data is calculated using 1-second bins in cleaned event files. If a bin has >2000 counts, and if more than 50% of those come from <1% of pixels, then it is considered to be noise-dominated and hence unusable.
| Quadrant | # 1 sec bins | Bins with >0 counts | Bins with >2000 counts | High rate bins dominated by noise | Noise dominated (total time) | Noise dominated (detector-on time) | Marked lightcurve |
|---|---|---|---|---|---|---|---|
| A | 6805 | 5996 | 1 | 1 | 0.01% | 0.02% |  |
| B | 6805 | 5996 | 0 | 0 | 0.00% | 0.00% |  |
| C | 6805 | 5996 | 0 | 0 | 0.00% | 0.00% |  |
| D | 6805 | 5996 | 511 | 511 | 7.51% | 8.52% |  |
Top three noisy pixels from each quadrant. If the there are fewer than three noisy pixels in the level2.evt file, extra rows are filled as -1
| Pixel properties | Quadrant properties | ||||||
|---|---|---|---|---|---|---|---|
| Quadrant | DetID | PixID | Counts | Sigma | Mean | Median | Sigma |
| A | 0 | 199 | 10477 | 73.1 | 655 | 639 | 134.6 |
| A | 0 | 226 | 7905 | 53.99 | 655 | 639 | 134.6 |
| A | 12 | 194 | 7289 | 49.41 | 655 | 639 | 134.6 |
| B | 12 | 111 | 9921 | 72.86 | 666 | 648 | 127.3 |
| B | 15 | 85 | 9171 | 66.97 | 666 | 648 | 127.3 |
| B | 11 | 111 | 8343 | 60.46 | 666 | 648 | 127.3 |
| C | 2 | 53 | 37343 | 243.29 | 648 | 648 | 150.8 |
| C | 8 | 112 | 29509 | 191.35 | 648 | 648 | 150.8 |
| C | 7 | 220 | 29346 | 190.27 | 648 | 648 | 150.8 |
| D | 11 | 130 | 1711106 | 11823.63 | 609 | 592 | 144.7 |
| D | 2 | 136 | 340428 | 2349.06 | 609 | 592 | 144.7 |
| D | 11 | 131 | 277635 | 1915.01 | 609 | 592 | 144.7 |
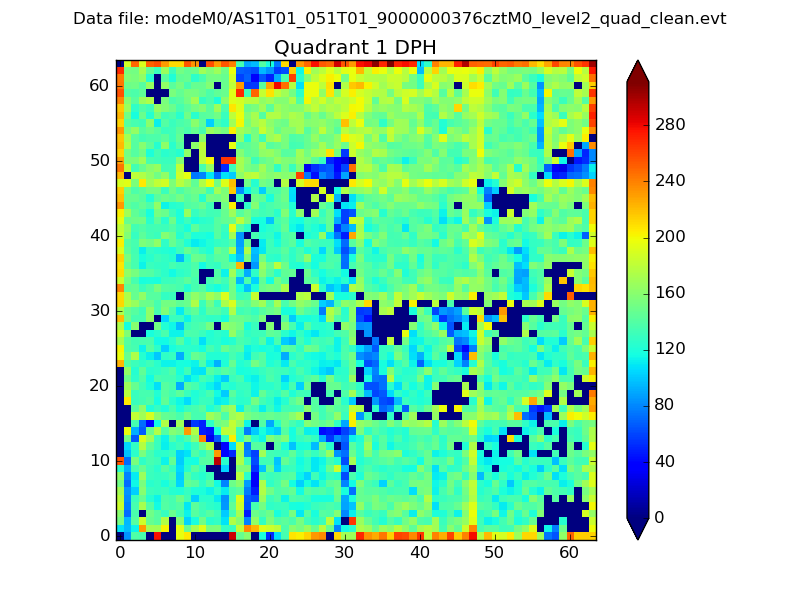
Histogram calculated using DETX and DETY for each event in the final _common_clean file
| Quadrant A |  |
 |
Quadrant B |
|---|---|---|---|
| Quadrant D |  |
 |
Quadrant C |
| Plot type | Count rate plots | Images |
|---|---|---|
| Comparison with Poisson distribution Blue bars denote a histogram of data divided into 1 sec bins. Red curve is a Poisson curve with rate = median count rate of data. |
 |
 |
| Quadrant-wise count rates Data is divided into 100 sec bins |
 |
|
| Module-wise count rates for Quadrant A Data is divided into 100 sec bins |
 |
 |
| Module-wise count rates for Quadrant B Data is divided into 100 sec bins |
 |
 |
| Module-wise count rates for Quadrant C Data is divided into 100 sec bins |
 |
 |
| Module-wise count rates for Quadrant D Data is divided into 100 sec bins |
 |
 |
| Parameter | Plot |
|---|---|
| CZT HV Monitor | 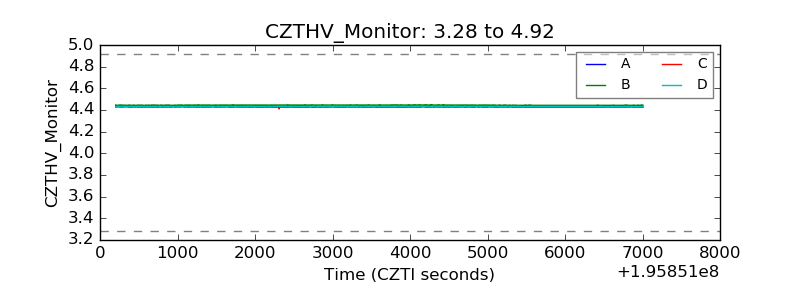 |
| D_VDD |  |
| Temperature 1 |  |
| Veto HV Monitor |  |
| Veto LLD |  |
| Alpha Counter |  |
| _CPM_Rate |  |
| CZT Counter |  |
| +2.5 Volts monitor |  |
| +5 Volts monitor |  |
| _ROLL_ROT |  |
| _Roll_DEC | 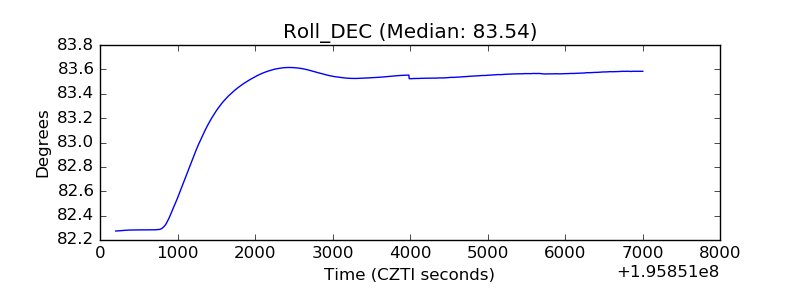 |
| _Roll_RA | 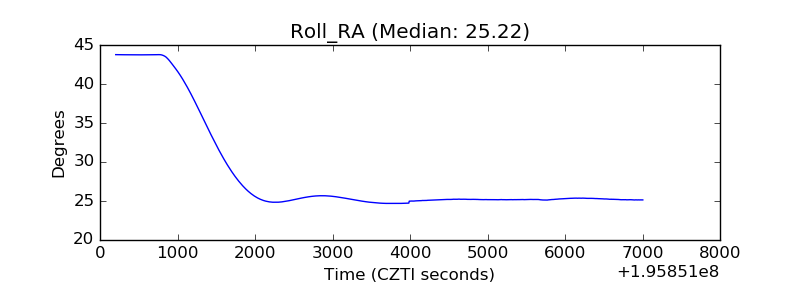 |
| Veto Counter | 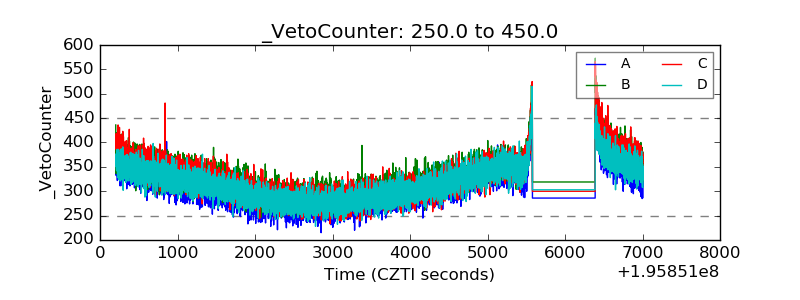 |