| Param | Original file | Final file |
|---|---|---|
| Filename | modeM0/AS1T01_034T01_9000000378cztM0_level2_bc.evt | modeM0/AS1T01_034T01_9000000378cztM0_level2_quad_clean.evt |
| Size (bytes) | 1,696,968,000 | 706,711,680 |
| Size | 1.6 GB | 674.0 MB |
| Events in quadrant A | 8,654,028 | 4,591,676 |
| Events in quadrant B | 8,733,256 | 4,682,999 |
| Events in quadrant C | 8,822,604 | 4,725,749 |
| Events in quadrant D | 22,082,504 | 4,286,088 |
| Mode M0 | |||
|---|---|---|---|
| Quadrant | BADHDUFLAG | Total packets | Discarded packets |
| A | 0 | 93208 | 0 |
| B | 0 | 93142 | 0 |
| C | 0 | 92807 | 0 |
| D | 0 | 144165 | 0 |
| Mode SS | |||
|---|---|---|---|
| Quadrant | BADHDUFLAG | Total packets | Discarded packets |
| A | 0 | 926 | 0 |
| B | 0 | 926 | 0 |
| C | 0 | 926 | 0 |
| D | 0 | 926 | 0 |
| Mode M9 | |||
|---|---|---|---|
| Quadrant | BADHDUFLAG | Total packets | Discarded packets |
| A | 0 | 80 | 0 |
| B | 0 | 80 | 0 |
| C | 0 | 80 | 0 |
| D | 0 | 80 | 0 |
| Quadrant | Total seconds | Saturated seconds | Saturation percentage |
|---|---|---|---|
| A | 45438 | 359 | 0.790088% |
| B | 45438 | 314 | 0.691052% |
| C | 45438 | 179 | 0.393943% |
| D | 45438 | 4328 | 9.525067% |
Noise dominated data is calculated using 1-second bins in cleaned event files. If a bin has >2000 counts, and if more than 50% of those come from <1% of pixels, then it is considered to be noise-dominated and hence unusable.
| Quadrant | # 1 sec bins | Bins with >0 counts | Bins with >2000 counts | High rate bins dominated by noise | Noise dominated (total time) | Noise dominated (detector-on time) | Marked lightcurve |
|---|---|---|---|---|---|---|---|
| A | 53543 | 45438 | 0 | 0 | 0.00% | 0.00% | 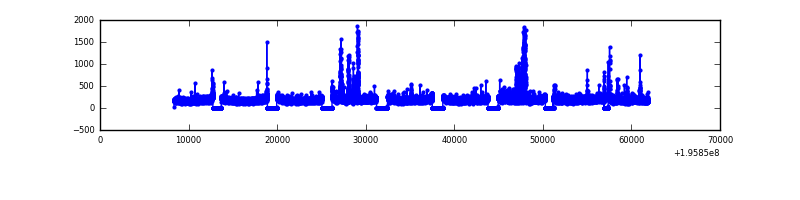 |
| B | 53543 | 45439 | 2 | 2 | 0.00% | 0.00% |  |
| C | 53543 | 45442 | 1 | 1 | 0.00% | 0.00% |  |
| D | 53543 | 45437 | 512 | 512 | 0.96% | 1.13% |  |
Top three noisy pixels from each quadrant. If the there are fewer than three noisy pixels in the level2.evt file, extra rows are filled as -1
| Pixel properties | Quadrant properties | ||||||
|---|---|---|---|---|---|---|---|
| Quadrant | DetID | PixID | Counts | Sigma | Mean | Median | Sigma |
| A | 8 | 15 | 295041 | 634.2 | 2093 | 2042 | 462.0 |
| A | 14 | 238 | 241141 | 517.53 | 2093 | 2042 | 462.0 |
| A | 12 | 133 | 36474 | 74.53 | 2093 | 2042 | 462.0 |
| B | 10 | 244 | 105752 | 268.27 | 2137 | 2075 | 386.5 |
| B | 15 | 85 | 89917 | 227.29 | 2137 | 2075 | 386.5 |
| B | 7 | 205 | 81666 | 205.94 | 2137 | 2075 | 386.5 |
| C | 14 | 223 | 105432 | 222.71 | 2104 | 2071 | 464.1 |
| C | 12 | 4 | 94435 | 199.01 | 2104 | 2071 | 464.1 |
| C | 5 | 250 | 75973 | 159.24 | 2104 | 2071 | 464.1 |
| D | 11 | 130 | 6484625 | 14116.58 | 1973 | 1915 | 459.2 |
| D | 11 | 131 | 4942905 | 10759.37 | 1973 | 1915 | 459.2 |
| D | 2 | 136 | 1044017 | 2269.25 | 1973 | 1915 | 459.2 |
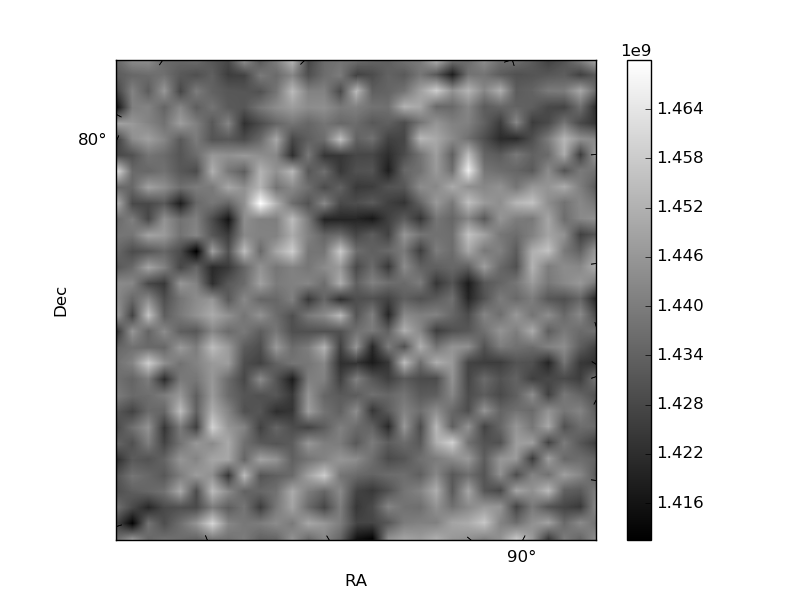
Histogram calculated using DETX and DETY for each event in the final _common_clean file
| Quadrant A | 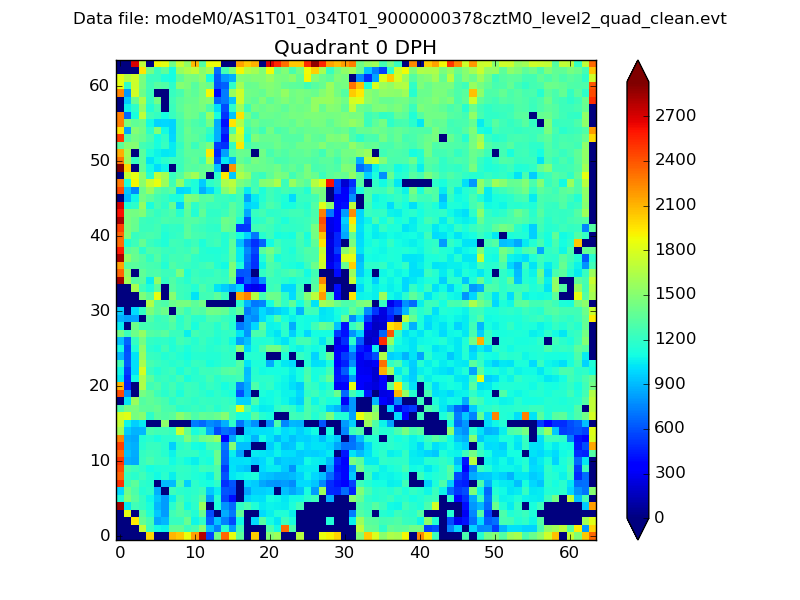 |
 |
Quadrant B |
|---|---|---|---|
| Quadrant D |  |
 |
Quadrant C |
| Plot type | Count rate plots | Images |
|---|---|---|
| Comparison with Poisson distribution Blue bars denote a histogram of data divided into 1 sec bins. Red curve is a Poisson curve with rate = median count rate of data. |
 |
 |
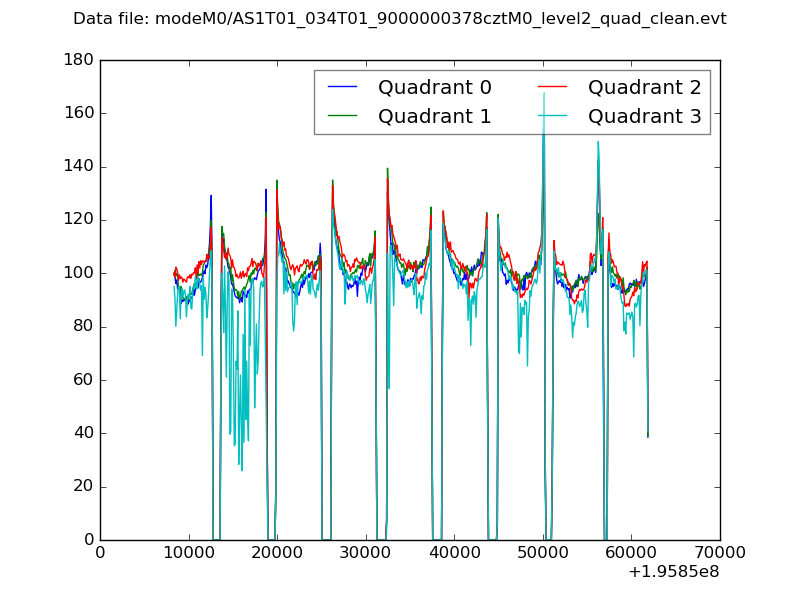
| Quadrant-wise count rates Data is divided into 100 sec bins |
 |
|
| Module-wise count rates for Quadrant A Data is divided into 100 sec bins |
 |
 |
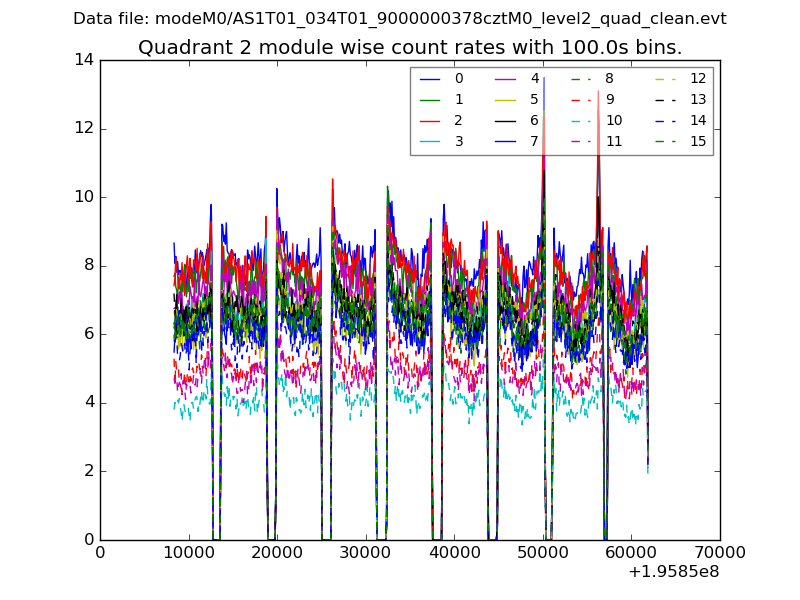
| Module-wise count rates for Quadrant B Data is divided into 100 sec bins |
 |
 |
| Module-wise count rates for Quadrant C Data is divided into 100 sec bins |
 |
 |
| Module-wise count rates for Quadrant D Data is divided into 100 sec bins |
 |
 |
| Parameter | Plot |
|---|---|
| CZT HV Monitor | 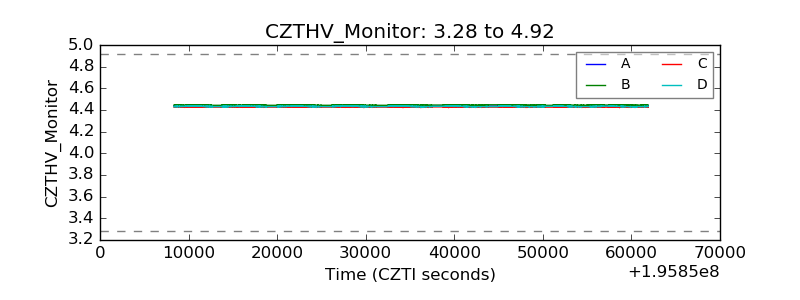 |
| D_VDD |  |
| Temperature 1 | 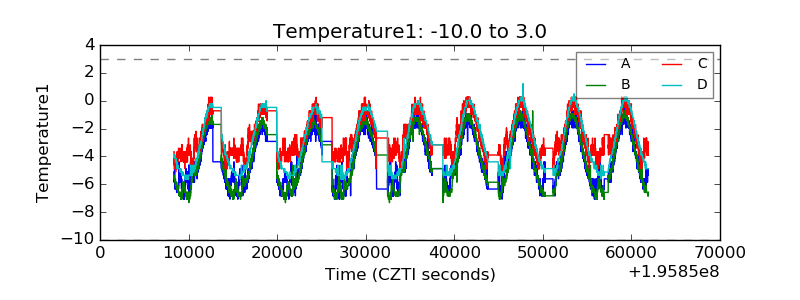 |
| Veto HV Monitor |  |
| Veto LLD |  |
| Alpha Counter |  |
| _CPM_Rate |  |
| CZT Counter |  |
| +2.5 Volts monitor |  |
| +5 Volts monitor |  |
| _ROLL_ROT |  |
| _Roll_DEC |  |
| _Roll_RA |  |
| Veto Counter |  |