| Param | Original file | Final file |
|---|---|---|
| Filename | modeM0/AS1T01_103T01_9000000374cztM0_level2.evt | modeM0/AS1T01_103T01_9000000374cztM0_level2_quad_clean.evt |
| Size (bytes) | 8,312,495,040 | 1,425,792,960 |
| Size | 7.7 GB | 1.3 GB |
| Events in quadrant A | 54,686,090 | 8,827,756 |
| Events in quadrant B | 56,319,343 | 8,957,623 |
| Events in quadrant C | 55,931,451 | 8,813,772 |
| Events in quadrant D | 76,546,723 | 8,200,264 |
| Mode SS | |||
|---|---|---|---|
| Quadrant | BADHDUFLAG | Total packets | Discarded packets |
| A | 0 | 2490 | 0 |
| B | 0 | 2490 | 0 |
| C | 0 | 2490 | 0 |
| D | 0 | 2490 | 0 |
| Mode M0 | |||
|---|---|---|---|
| Quadrant | BADHDUFLAG | Total packets | Discarded packets |
| A | 0 | 252841 | 0 |
| B | 0 | 255746 | 0 |
| C | 0 | 254919 | 0 |
| D | 0 | 314766 | 0 |
| Mode M9 | |||
|---|---|---|---|
| Quadrant | BADHDUFLAG | Total packets | Discarded packets |
| A | 0 | 161 | 0 |
| B | 0 | 161 | 0 |
| C | 0 | 161 | 0 |
| D | 0 | 161 | 0 |
| Quadrant | Total seconds | Saturated seconds | Saturation percentage |
|---|---|---|---|
| A | 122343 | 1816 | 1.484351% |
| B | 122344 | 2130 | 1.740993% |
| C | 122343 | 1699 | 1.388719% |
| D | 122344 | 8414 | 6.877329% |
Noise dominated data is calculated using 1-second bins in cleaned event files. If a bin has >2000 counts, and if more than 50% of those come from <1% of pixels, then it is considered to be noise-dominated and hence unusable.
| Quadrant | # 1 sec bins | Bins with >0 counts | Bins with >2000 counts | High rate bins dominated by noise | Noise dominated (total time) | Noise dominated (detector-on time) | Marked lightcurve |
|---|---|---|---|---|---|---|---|
| A | 142742 | 122369 | 20 | 20 | 0.01% | 0.02% |  |
| B | 142742 | 122369 | 196 | 196 | 0.14% | 0.16% |  |
| C | 142742 | 122369 | 266 | 266 | 0.19% | 0.22% |  |
| D | 142742 | 122368 | 5338 | 5338 | 3.74% | 4.36% |  |
Top three noisy pixels from each quadrant. If the there are fewer than three noisy pixels in the level2.evt file, extra rows are filled as -1
| Pixel properties | Quadrant properties | ||||||
|---|---|---|---|---|---|---|---|
| Quadrant | DetID | PixID | Counts | Sigma | Mean | Median | Sigma |
| A | 0 | 128 | 968950 | 339.8 | 13871 | 13566 | 2811.6 |
| A | 15 | 236 | 308332 | 104.84 | 13871 | 13566 | 2811.6 |
| A | 12 | 194 | 152957 | 49.58 | 13871 | 13566 | 2811.6 |
| B | 6 | 36 | 1003694 | 373.01 | 14031 | 13670 | 2654.1 |
| B | 3 | 220 | 367859 | 133.45 | 14031 | 13670 | 2654.1 |
| B | 7 | 205 | 232308 | 82.38 | 14031 | 13670 | 2654.1 |
| C | 2 | 53 | 1071296 | 337.98 | 13491 | 13499 | 3129.7 |
| C | 14 | 223 | 578069 | 180.39 | 13491 | 13499 | 3129.7 |
| C | 10 | 82 | 442869 | 137.19 | 13491 | 13499 | 3129.7 |
| D | 11 | 130 | 19715891 | 6490.58 | 12910 | 12589 | 3035.7 |
| D | 11 | 131 | 4356083 | 1430.81 | 12910 | 12589 | 3035.7 |
| D | 2 | 184 | 1055616 | 343.59 | 12910 | 12589 | 3035.7 |
Histogram calculated using DETX and DETY for each event in the final _common_clean file
| Quadrant A | 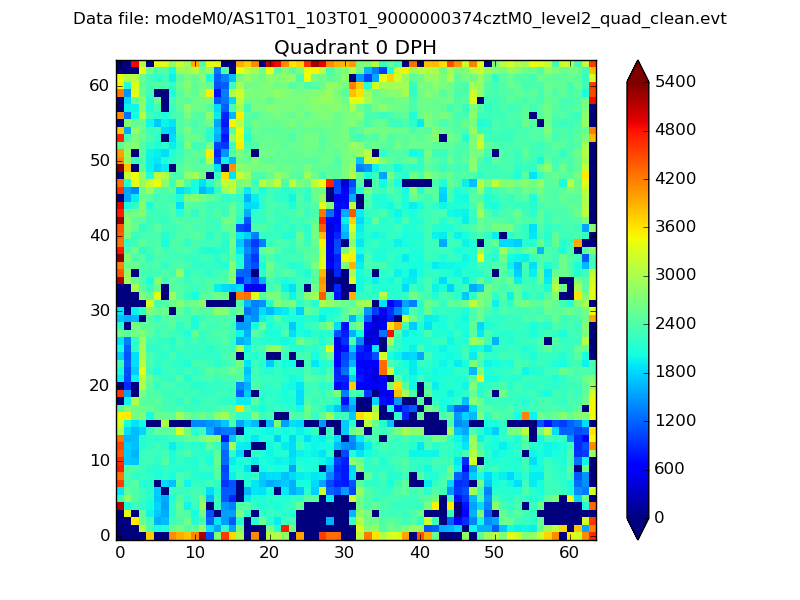 |
 |
Quadrant B |
|---|---|---|---|
| Quadrant D |  |
 |
Quadrant C |
| Plot type | Count rate plots | Images |
|---|---|---|
| Comparison with Poisson distribution Blue bars denote a histogram of data divided into 1 sec bins. Red curve is a Poisson curve with rate = median count rate of data. |
 |
 |
| Quadrant-wise count rates Data is divided into 100 sec bins |
 |
|
| Module-wise count rates for Quadrant A Data is divided into 100 sec bins |
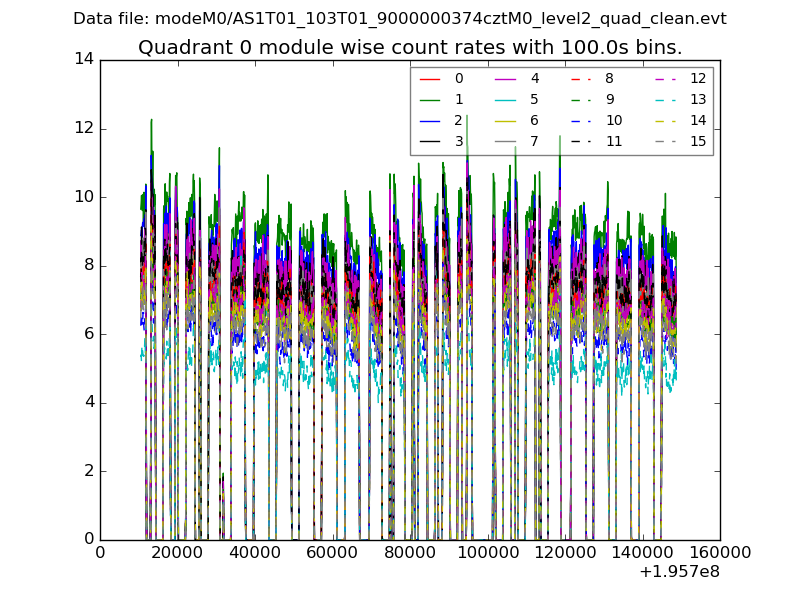 |
 |
| Module-wise count rates for Quadrant B Data is divided into 100 sec bins |
 |
 |
| Module-wise count rates for Quadrant C Data is divided into 100 sec bins |
 |
 |
| Module-wise count rates for Quadrant D Data is divided into 100 sec bins |
 |
 |
| Parameter | Plot |
|---|---|
| CZT HV Monitor | 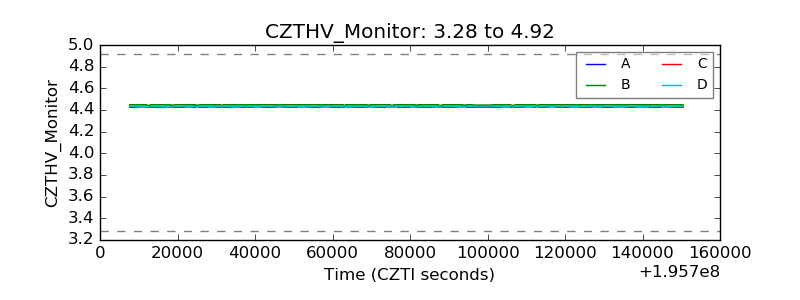 |
| D_VDD |  |
| Temperature 1 |  |
| Veto HV Monitor |  |
| Veto LLD |  |
| Alpha Counter | 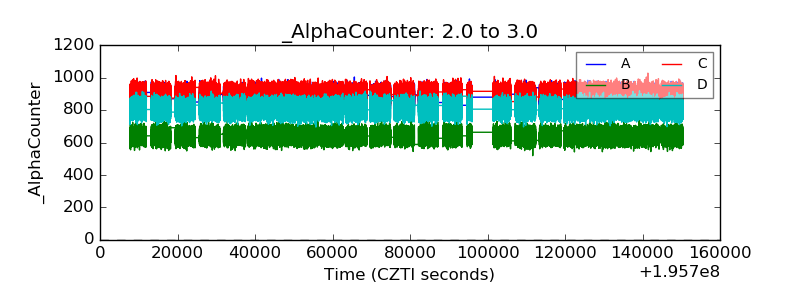 |
| _CPM_Rate |  |
| CZT Counter |  |
| +2.5 Volts monitor |  |
| +5 Volts monitor |  |
| _ROLL_ROT |  |
| _Roll_DEC |  |
| _Roll_RA |  |
| Veto Counter |  |