| Param | Original file | Final file |
|---|---|---|
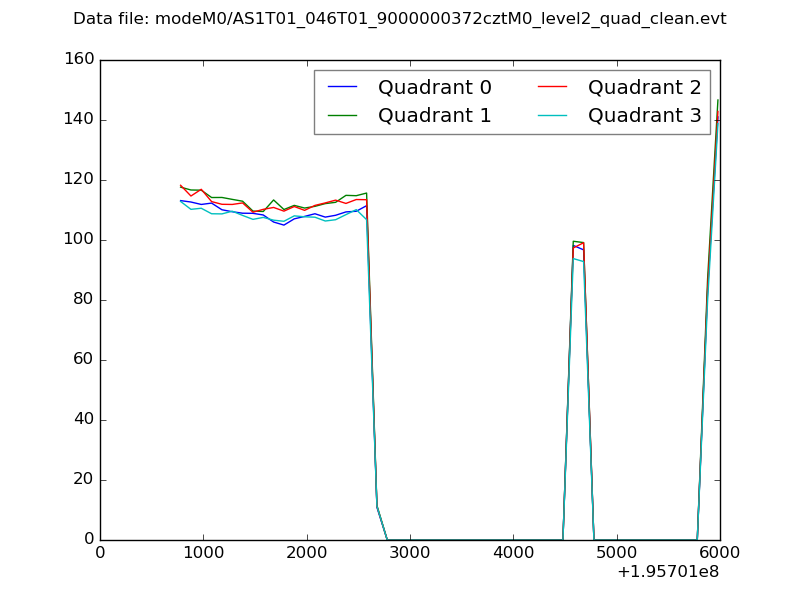
| Filename | modeM0/AS1T01_046T01_9000000372cztM0_level2_bc.evt | modeM0/AS1T01_046T01_9000000372cztM0_level2_quad_clean.evt |
| Size (bytes) | 116,519,040 | 43,107,840 |
| Size | 111.1 MB | 41.1 MB |
| Events in quadrant A | 754,993 | 250,645 |
| Events in quadrant B | 757,938 | 259,572 |
| Events in quadrant C | 878,222 | 257,026 |
| Events in quadrant D | 848,771 | 247,449 |
| Mode M0 | |||
|---|---|---|---|
| Quadrant | BADHDUFLAG | Total packets | Discarded packets |
| A | 0 | 8399 | 0 |
| B | 0 | 8391 | 0 |
| C | 0 | 8595 | 0 |
| D | 0 | 8713 | 0 |
| Mode M9 | |||
|---|---|---|---|
| Quadrant | BADHDUFLAG | Total packets | Discarded packets |
| A | 0 | 12 | 0 |
| B | 0 | 12 | 0 |
| C | 0 | 12 | 0 |
| D | 0 | 12 | 0 |
| Mode SS | |||
|---|---|---|---|
| Quadrant | BADHDUFLAG | Total packets | Discarded packets |
| A | 0 | 84 | 0 |
| B | 0 | 84 | 0 |
| C | 0 | 84 | 0 |
| D | 0 | 84 | 0 |
| Quadrant | Total seconds | Saturated seconds | Saturation percentage |
|---|---|---|---|
| A | 4118 | 8 | 0.194269% |
| B | 4118 | 17 | 0.412822% |
| C | 4118 | 4 | 0.097135% |
| D | 4118 | 21 | 0.509956% |
Noise dominated data is calculated using 1-second bins in cleaned event files. If a bin has >2000 counts, and if more than 50% of those come from <1% of pixels, then it is considered to be noise-dominated and hence unusable.
| Quadrant | # 1 sec bins | Bins with >0 counts | Bins with >2000 counts | High rate bins dominated by noise | Noise dominated (total time) | Noise dominated (detector-on time) | Marked lightcurve |
|---|---|---|---|---|---|---|---|
| A | 5299 | 4119 | 0 | 0 | 0.00% | 0.00% |  |
| B | 5299 | 4119 | 0 | 0 | 0.00% | 0.00% | 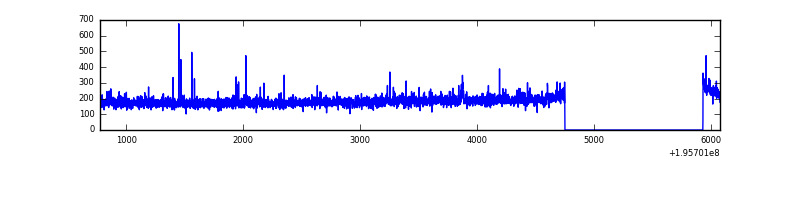 |
| C | 5299 | 4119 | 0 | 0 | 0.00% | 0.00% |  |
| D | 5299 | 4119 | 1 | 1 | 0.02% | 0.02% | 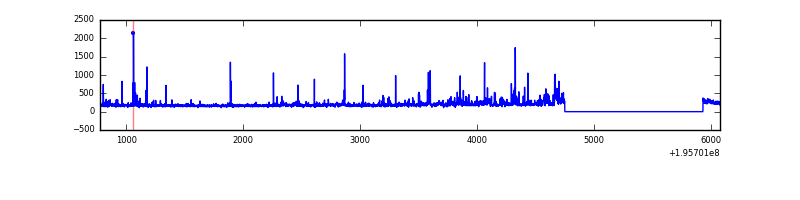 |
Top three noisy pixels from each quadrant. If the there are fewer than three noisy pixels in the level2.evt file, extra rows are filled as -1
| Pixel properties | Quadrant properties | ||||||
|---|---|---|---|---|---|---|---|
| Quadrant | DetID | PixID | Counts | Sigma | Mean | Median | Sigma |
| A | 15 | 236 | 13504 | 303.43 | 191 | 186 | 43.9 |
| A | 14 | 238 | 3290 | 70.72 | 191 | 186 | 43.9 |
| A | 0 | 128 | 2099 | 43.58 | 191 | 186 | 43.9 |
| B | 4 | 173 | 3372 | 83.37 | 194 | 188 | 38.2 |
| B | 15 | 85 | 2908 | 71.22 | 194 | 188 | 38.2 |
| B | 5 | 6 | 2330 | 56.09 | 194 | 188 | 38.2 |
| C | 14 | 223 | 86060 | 1971.85 | 188 | 184 | 43.6 |
| C | 10 | 65 | 27184 | 619.96 | 188 | 184 | 43.6 |
| C | 12 | 4 | 13683 | 309.96 | 188 | 184 | 43.6 |
| D | 2 | 184 | 47771 | 1069.41 | 186 | 179 | 44.5 |
| D | 5 | 172 | 21210 | 472.57 | 186 | 179 | 44.5 |
| D | 11 | 130 | 14053 | 311.75 | 186 | 179 | 44.5 |
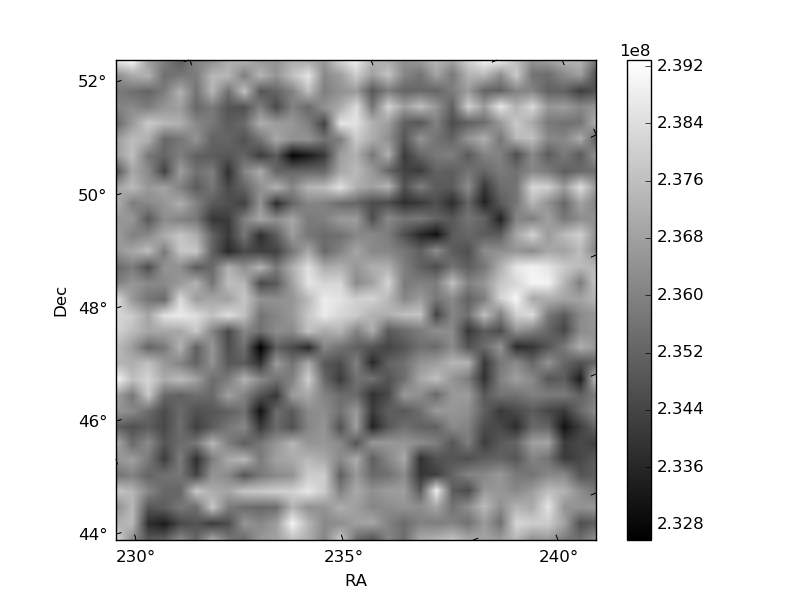
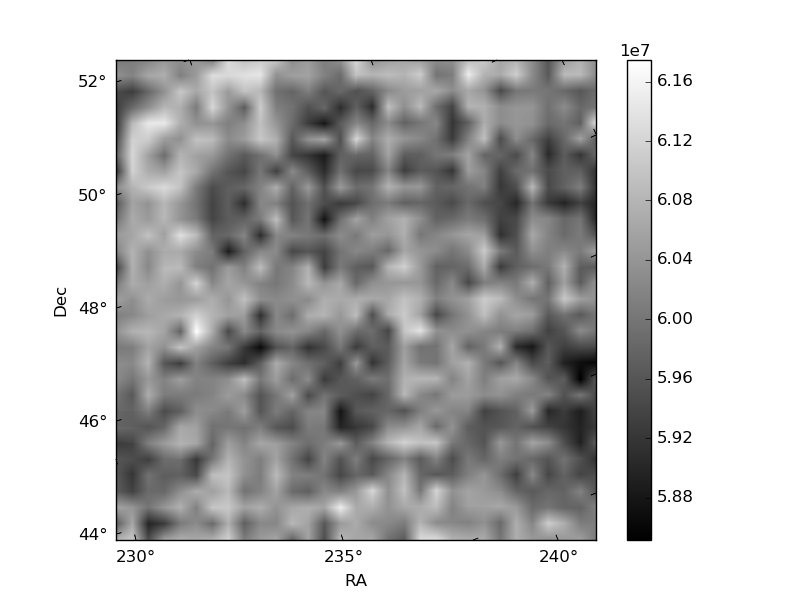
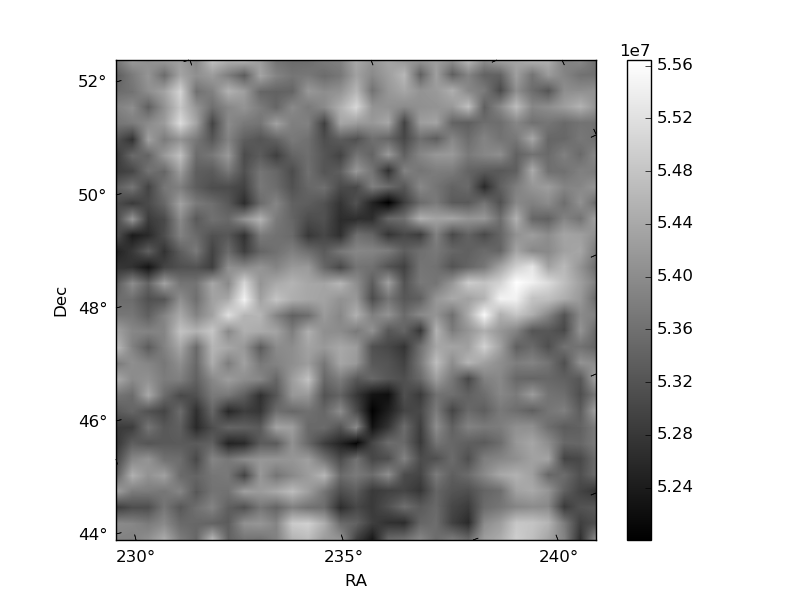
Histogram calculated using DETX and DETY for each event in the final _common_clean file
| Quadrant A |  |
 |
Quadrant B |
|---|---|---|---|
| Quadrant D | 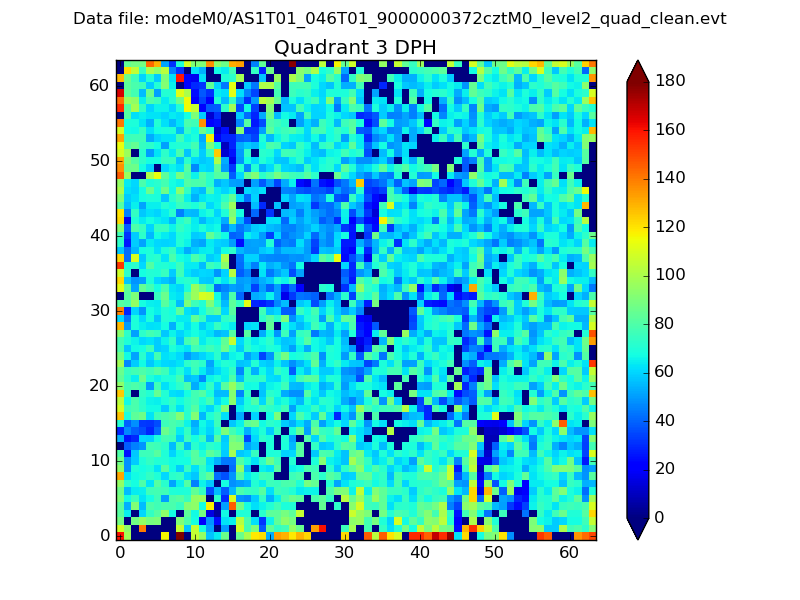 |
 |
Quadrant C |
| Plot type | Count rate plots | Images |
|---|---|---|
| Comparison with Poisson distribution Blue bars denote a histogram of data divided into 1 sec bins. Red curve is a Poisson curve with rate = median count rate of data. |
 |
 |
| Quadrant-wise count rates Data is divided into 100 sec bins |
 |
|
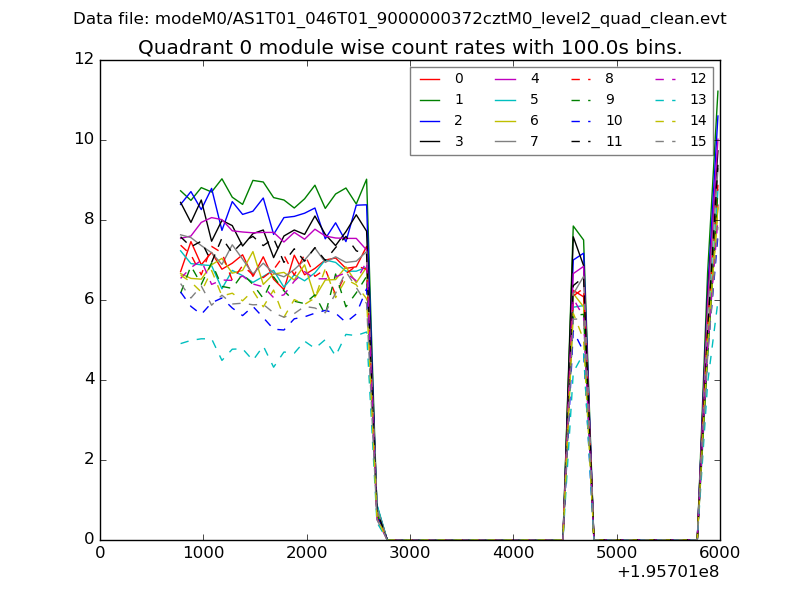
| Module-wise count rates for Quadrant A Data is divided into 100 sec bins |
 |
 |
| Module-wise count rates for Quadrant B Data is divided into 100 sec bins |
 |
 |
| Module-wise count rates for Quadrant C Data is divided into 100 sec bins |
 |
 |
| Module-wise count rates for Quadrant D Data is divided into 100 sec bins |
 |
 |
| Parameter | Plot |
|---|---|
| CZT HV Monitor |  |
| D_VDD |  |
| Temperature 1 |  |
| Veto HV Monitor |  |
| Veto LLD |  |
| Alpha Counter | 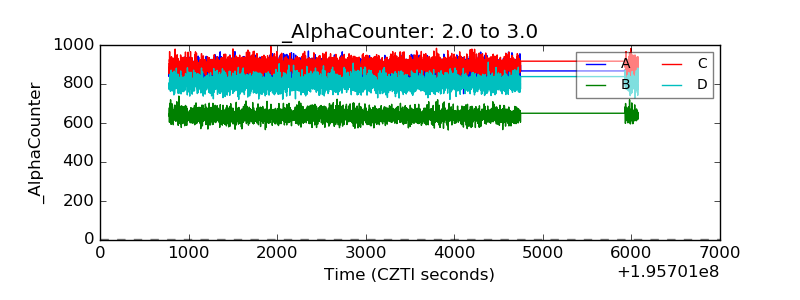 |
| _CPM_Rate |  |
| CZT Counter | 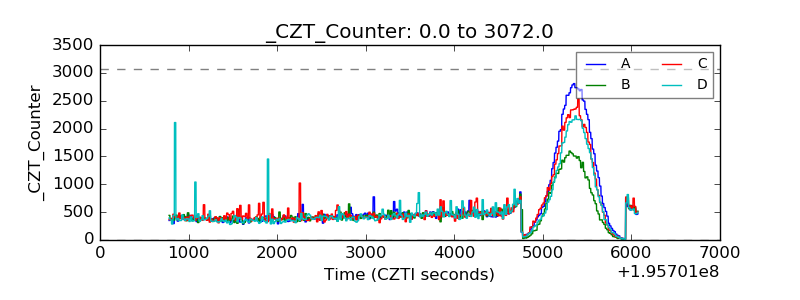 |
| +2.5 Volts monitor | 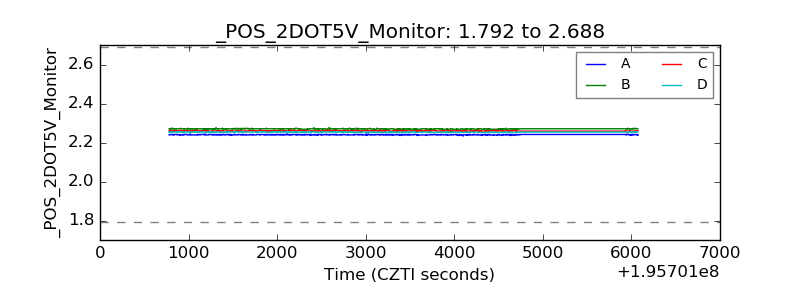 |
| +5 Volts monitor |  |
| _ROLL_ROT |  |
| _Roll_DEC |  |
| _Roll_RA | 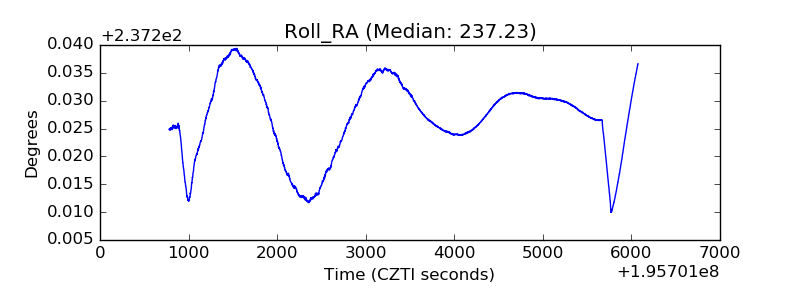 |
| Veto Counter | 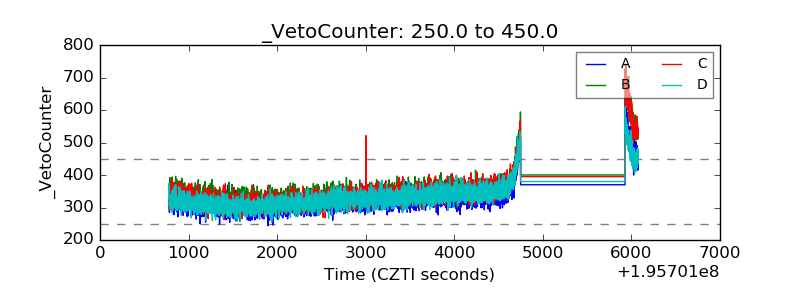 |