| Param | Original file | Final file |
|---|---|---|
| Filename | modeM0/AS1T01_046T01_9000000372cztM0_level2_bc.evt | modeM0/AS1T01_046T01_9000000372cztM0_level2_quad_clean.evt |
| Size (bytes) | 2,280,271,680 | 973,952,640 |
| Size | 2.1 GB | 928.8 MB |
| Events in quadrant A | 14,760,750 | 6,032,610 |
| Events in quadrant B | 14,871,093 | 6,164,143 |
| Events in quadrant C | 16,557,514 | 6,050,196 |
| Events in quadrant D | 17,551,881 | 5,911,398 |
| Mode M0 | |||
|---|---|---|---|
| Quadrant | BADHDUFLAG | Total packets | Discarded packets |
| A | 0 | 160023 | 0 |
| B | 0 | 160372 | 0 |
| C | 0 | 167153 | 0 |
| D | 0 | 169382 | 0 |
| Mode M9 | |||
|---|---|---|---|
| Quadrant | BADHDUFLAG | Total packets | Discarded packets |
| A | 0 | 120 | 0 |
| B | 0 | 120 | 0 |
| C | 0 | 119 | 0 |
| D | 0 | 120 | 0 |
| Mode SS | |||
|---|---|---|---|
| Quadrant | BADHDUFLAG | Total packets | Discarded packets |
| A | 0 | 1588 | 0 |
| B | 0 | 1588 | 0 |
| C | 0 | 1586 | 0 |
| D | 0 | 1584 | 0 |
| Quadrant | Total seconds | Saturated seconds | Saturation percentage |
|---|---|---|---|
| A | 77921 | 947 | 1.215333% |
| B | 77921 | 915 | 1.174266% |
| C | 77913 | 1667 | 2.139566% |
| D | 77905 | 1214 | 1.558308% |
Noise dominated data is calculated using 1-second bins in cleaned event files. If a bin has >2000 counts, and if more than 50% of those come from <1% of pixels, then it is considered to be noise-dominated and hence unusable.
| Quadrant | # 1 sec bins | Bins with >0 counts | Bins with >2000 counts | High rate bins dominated by noise | Noise dominated (total time) | Noise dominated (detector-on time) | Marked lightcurve |
|---|---|---|---|---|---|---|---|
| A | 89347 | 77983 | 4 | 4 | 0.00% | 0.01% |  |
| B | 89347 | 77974 | 2 | 2 | 0.00% | 0.00% |  |
| C | 89347 | 77967 | 218 | 218 | 0.24% | 0.28% |  |
| D | 89347 | 77967 | 100 | 100 | 0.11% | 0.13% |  |
Top three noisy pixels from each quadrant. If the there are fewer than three noisy pixels in the level2.evt file, extra rows are filled as -1
| Pixel properties | Quadrant properties | ||||||
|---|---|---|---|---|---|---|---|
| Quadrant | DetID | PixID | Counts | Sigma | Mean | Median | Sigma |
| A | 8 | 15 | 400517 | 498.03 | 3630 | 3538 | 797.1 |
| A | 12 | 133 | 270370 | 334.75 | 3630 | 3538 | 797.1 |
| A | 0 | 199 | 39632 | 45.28 | 3630 | 3538 | 797.1 |
| B | 10 | 244 | 133392 | 195.2 | 3684 | 3564 | 665.1 |
| B | 5 | 6 | 99879 | 144.81 | 3684 | 3564 | 665.1 |
| B | 4 | 200 | 84409 | 121.55 | 3684 | 3564 | 665.1 |
| C | 9 | 144 | 1914327 | 2453.61 | 3555 | 3487 | 778.8 |
| C | 10 | 65 | 190793 | 240.51 | 3555 | 3487 | 778.8 |
| C | 12 | 4 | 143121 | 179.3 | 3555 | 3487 | 778.8 |
| D | 2 | 184 | 938088 | 1140.3 | 3557 | 3437 | 819.7 |
| D | 11 | 130 | 531839 | 644.67 | 3557 | 3437 | 819.7 |
| D | 12 | 110 | 426897 | 516.63 | 3557 | 3437 | 819.7 |
Histogram calculated using DETX and DETY for each event in the final _common_clean file
| Quadrant A |  |
 |
Quadrant B |
|---|---|---|---|
| Quadrant D |  |
 |
Quadrant C |
| Plot type | Count rate plots | Images |
|---|---|---|
| Comparison with Poisson distribution Blue bars denote a histogram of data divided into 1 sec bins. Red curve is a Poisson curve with rate = median count rate of data. |
 |
 |
| Quadrant-wise count rates Data is divided into 100 sec bins |
 |
|
| Module-wise count rates for Quadrant A Data is divided into 100 sec bins |
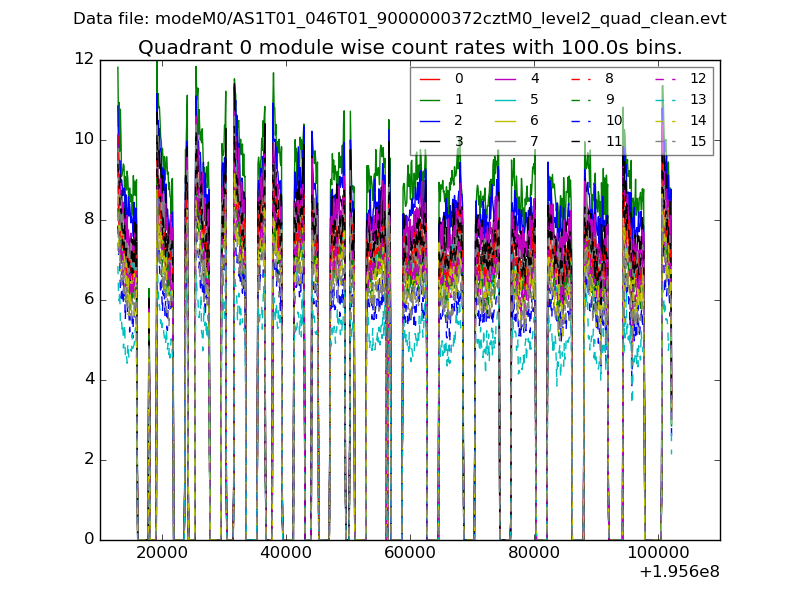 |
 |
| Module-wise count rates for Quadrant B Data is divided into 100 sec bins |
 |
 |
| Module-wise count rates for Quadrant C Data is divided into 100 sec bins |
 |
 |
| Module-wise count rates for Quadrant D Data is divided into 100 sec bins |
 |
 |
| Parameter | Plot |
|---|---|
| CZT HV Monitor |  |
| D_VDD |  |
| Temperature 1 |  |
| Veto HV Monitor |  |
| Veto LLD |  |
| Alpha Counter |  |
| _CPM_Rate |  |
| CZT Counter |  |
| +2.5 Volts monitor |  |
| +5 Volts monitor |  |
| _ROLL_ROT |  |
| _Roll_DEC |  |
| _Roll_RA |  |
| Veto Counter |  |