| Param | Original file | Final file |
|---|---|---|
| Filename | modeM0/AS1G02_018T06_9000000370cztM0_level2_bc.evt | modeM0/AS1G02_018T06_9000000370cztM0_level2_quad_clean.evt |
| Size (bytes) | 202,703,040 | 79,940,160 |
| Size | 193.3 MB | 76.2 MB |
| Events in quadrant A | 1,293,261 | 480,861 |
| Events in quadrant B | 1,359,466 | 490,104 |
| Events in quadrant C | 1,330,970 | 487,820 |
| Events in quadrant D | 1,668,643 | 473,098 |
| Mode M9 | |||
|---|---|---|---|
| Quadrant | BADHDUFLAG | Total packets | Discarded packets |
| A | 0 | 8 | 0 |
| B | 0 | 8 | 0 |
| C | 0 | 8 | 0 |
| D | 0 | 9 | 0 |
| Mode M0 | |||
|---|---|---|---|
| Quadrant | BADHDUFLAG | Total packets | Discarded packets |
| A | 0 | 14371 | 2 |
| B | 0 | 14508 | 2 |
| C | 0 | 14369 | 2 |
| D | 0 | 15864 | 2 |
| Mode SS | |||
|---|---|---|---|
| Quadrant | BADHDUFLAG | Total packets | Discarded packets |
| A | 0 | 144 | 0 |
| B | 0 | 144 | 0 |
| C | 0 | 144 | 0 |
| D | 0 | 144 | 0 |
| Quadrant | Total seconds | Saturated seconds | Saturation percentage |
|---|---|---|---|
| A | 7016 | 39 | 0.555872% |
| B | 7016 | 51 | 0.726910% |
| C | 7016 | 44 | 0.627138% |
| D | 7016 | 102 | 1.453820% |
Noise dominated data is calculated using 1-second bins in cleaned event files. If a bin has >2000 counts, and if more than 50% of those come from <1% of pixels, then it is considered to be noise-dominated and hence unusable.
| Quadrant | # 1 sec bins | Bins with >0 counts | Bins with >2000 counts | High rate bins dominated by noise | Noise dominated (total time) | Noise dominated (detector-on time) | Marked lightcurve |
|---|---|---|---|---|---|---|---|
| A | 7670 | 7015 | 0 | 0 | 0.00% | 0.00% |  |
| B | 7670 | 7015 | 0 | 0 | 0.00% | 0.00% | 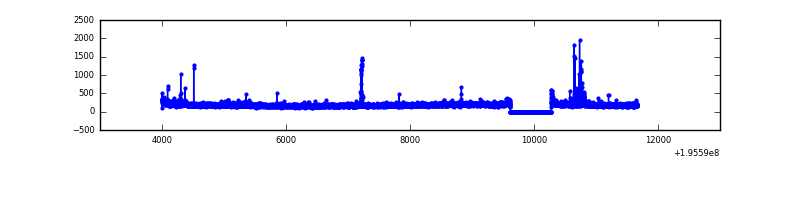 |
| C | 7670 | 7015 | 2 | 2 | 0.03% | 0.03% | 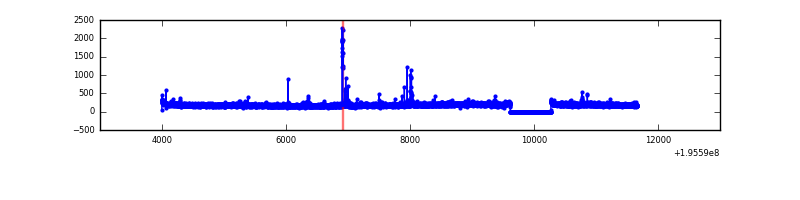 |
| D | 7670 | 7016 | 4 | 4 | 0.05% | 0.06% |  |
Top three noisy pixels from each quadrant. If the there are fewer than three noisy pixels in the level2.evt file, extra rows are filled as -1
| Pixel properties | Quadrant properties | ||||||
|---|---|---|---|---|---|---|---|
| Quadrant | DetID | PixID | Counts | Sigma | Mean | Median | Sigma |
| A | 8 | 15 | 42006 | 575.01 | 320 | 311 | 72.5 |
| A | 14 | 63 | 9305 | 124.03 | 320 | 311 | 72.5 |
| A | 3 | 254 | 4570 | 58.73 | 320 | 311 | 72.5 |
| B | 4 | 200 | 41007 | 651.71 | 327 | 316 | 62.4 |
| B | 10 | 244 | 30035 | 475.98 | 327 | 316 | 62.4 |
| B | 15 | 85 | 10351 | 160.72 | 327 | 316 | 62.4 |
| C | 10 | 65 | 43058 | 600.83 | 317 | 312 | 71.1 |
| C | 12 | 4 | 15723 | 216.61 | 317 | 312 | 71.1 |
| C | 8 | 208 | 7708 | 103.96 | 317 | 312 | 71.1 |
| D | 2 | 184 | 300222 | 4004.88 | 315 | 305 | 74.9 |
| D | 7 | 67 | 112489 | 1498.02 | 315 | 305 | 74.9 |
| D | 5 | 172 | 14272 | 186.51 | 315 | 305 | 74.9 |
Histogram calculated using DETX and DETY for each event in the final _common_clean file
| Quadrant A |  |
 |
Quadrant B |
|---|---|---|---|
| Quadrant D | 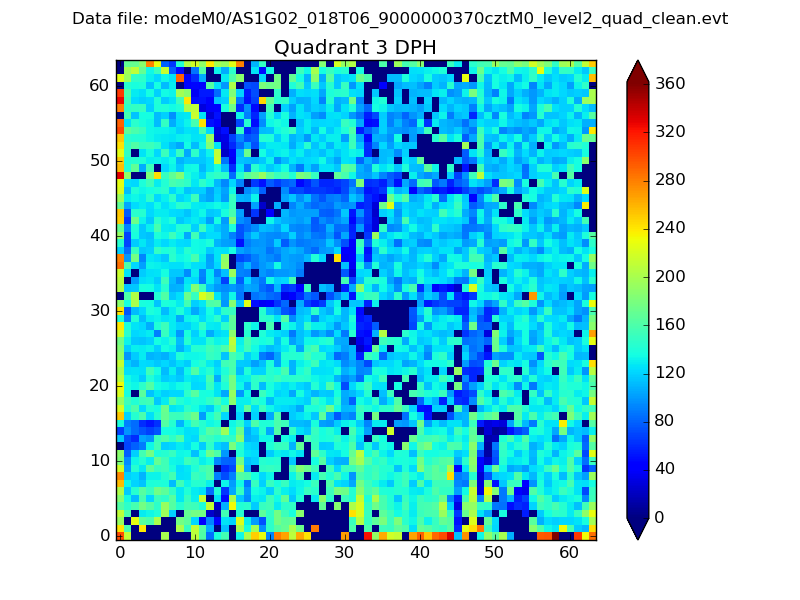 |
 |
Quadrant C |
| Plot type | Count rate plots | Images |
|---|---|---|
| Comparison with Poisson distribution Blue bars denote a histogram of data divided into 1 sec bins. Red curve is a Poisson curve with rate = median count rate of data. |
 |
 |
| Quadrant-wise count rates Data is divided into 100 sec bins |
 |
|
| Module-wise count rates for Quadrant A Data is divided into 100 sec bins |
 |
 |
| Module-wise count rates for Quadrant B Data is divided into 100 sec bins |
 |
 |
| Module-wise count rates for Quadrant C Data is divided into 100 sec bins |
 |
 |
| Module-wise count rates for Quadrant D Data is divided into 100 sec bins |
 |
 |
| Parameter | Plot |
|---|---|
| CZT HV Monitor | 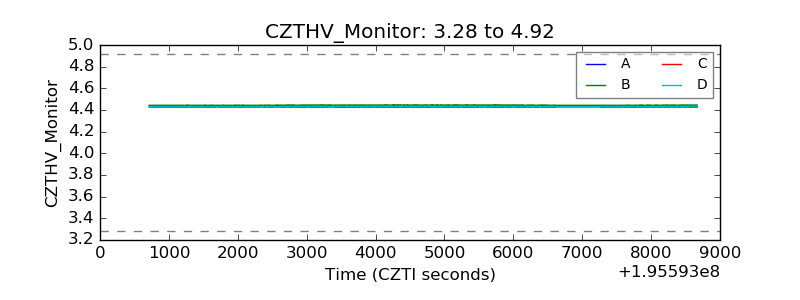 |
| D_VDD |  |
| Temperature 1 | 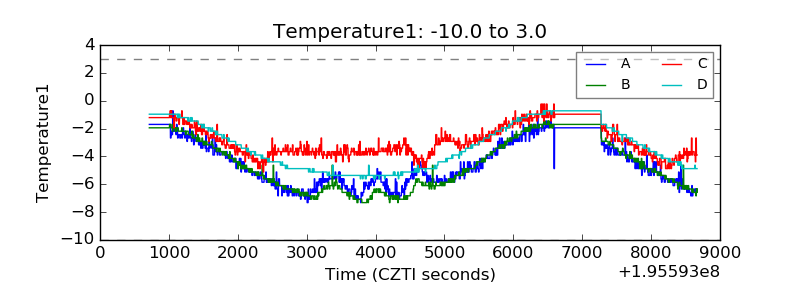 |
| Veto HV Monitor | 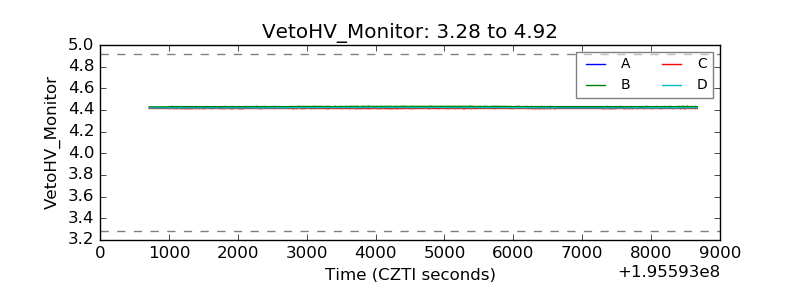 |
| Veto LLD | 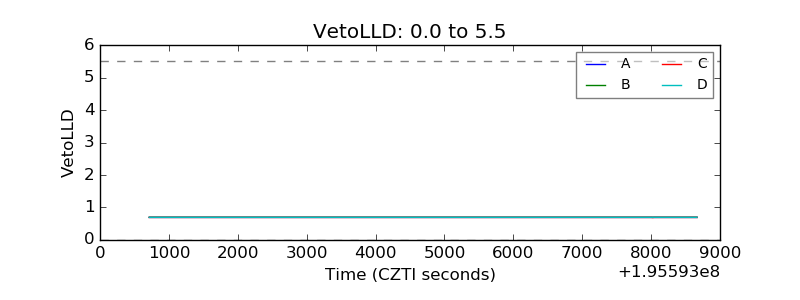 |
| Alpha Counter |  |
| _CPM_Rate |  |
| CZT Counter |  |
| +2.5 Volts monitor | 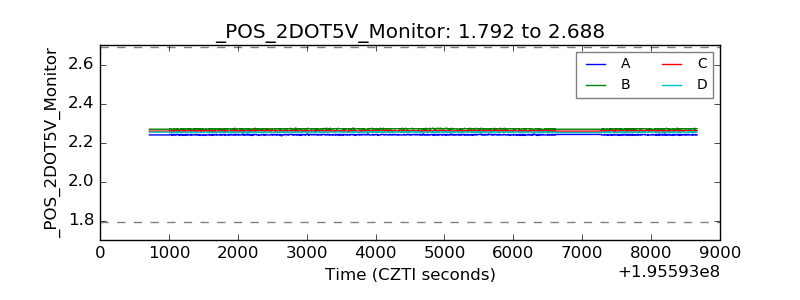 |
| +5 Volts monitor |  |
| _ROLL_ROT | 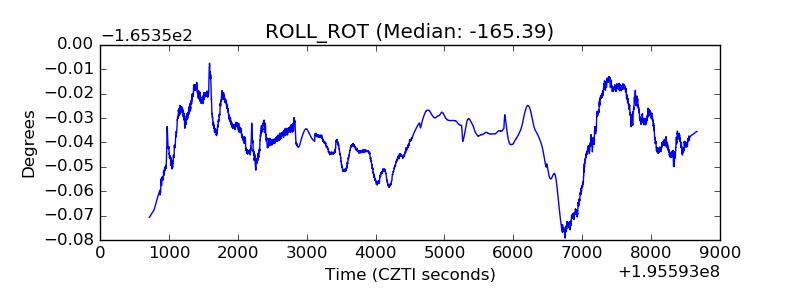 |
| _Roll_DEC |  |
| _Roll_RA |  |
| Veto Counter |  |