| Param | Original file | Final file |
|---|---|---|
| Filename | modeM0/AS1T01_046T01_9000000372cztM0_level2_bc.evt | modeM0/AS1T01_046T01_9000000372cztM0_level2_quad_clean.evt |
| Size (bytes) | 296,380,800 | 106,038,720 |
| Size | 282.7 MB | 101.1 MB |
| Events in quadrant A | 1,745,018 | 634,804 |
| Events in quadrant B | 1,791,721 | 656,817 |
| Events in quadrant C | 2,069,843 | 634,210 |
| Events in quadrant D | 2,704,682 | 617,277 |
| Mode M0 | |||
|---|---|---|---|
| Quadrant | BADHDUFLAG | Total packets | Discarded packets |
| A | 0 | 19560 | 0 |
| B | 0 | 19713 | 0 |
| C | 0 | 20884 | 0 |
| D | 0 | 23406 | 0 |
| Mode M9 | |||
|---|---|---|---|
| Quadrant | BADHDUFLAG | Total packets | Discarded packets |
| A | 0 | 18 | 0 |
| B | 0 | 18 | 0 |
| C | 0 | 18 | 0 |
| D | 0 | 18 | 0 |
| Mode SS | |||
|---|---|---|---|
| Quadrant | BADHDUFLAG | Total packets | Discarded packets |
| A | 0 | 198 | 0 |
| B | 0 | 198 | 0 |
| C | 0 | 198 | 0 |
| D | 0 | 198 | 0 |
| Quadrant | Total seconds | Saturated seconds | Saturation percentage |
|---|---|---|---|
| A | 9632 | 31 | 0.321844% |
| B | 9632 | 60 | 0.622924% |
| C | 9631 | 229 | 2.377739% |
| D | 9632 | 250 | 2.595515% |
Noise dominated data is calculated using 1-second bins in cleaned event files. If a bin has >2000 counts, and if more than 50% of those come from <1% of pixels, then it is considered to be noise-dominated and hence unusable.
| Quadrant | # 1 sec bins | Bins with >0 counts | Bins with >2000 counts | High rate bins dominated by noise | Noise dominated (total time) | Noise dominated (detector-on time) | Marked lightcurve |
|---|---|---|---|---|---|---|---|
| A | 11483 | 9633 | 0 | 0 | 0.00% | 0.00% |  |
| B | 11483 | 9633 | 0 | 0 | 0.00% | 0.00% |  |
| C | 11483 | 9634 | 11 | 11 | 0.10% | 0.11% |  |
| D | 11483 | 9633 | 5 | 5 | 0.04% | 0.05% |  |
Top three noisy pixels from each quadrant. If the there are fewer than three noisy pixels in the level2.evt file, extra rows are filled as -1
| Pixel properties | Quadrant properties | ||||||
|---|---|---|---|---|---|---|---|
| Quadrant | DetID | PixID | Counts | Sigma | Mean | Median | Sigma |
| A | 14 | 63 | 15724 | 153.03 | 444 | 432 | 99.9 |
| A | 8 | 15 | 11871 | 114.47 | 444 | 432 | 99.9 |
| A | 3 | 254 | 9088 | 86.62 | 444 | 432 | 99.9 |
| B | 4 | 200 | 26301 | 305.78 | 452 | 437 | 84.6 |
| B | 10 | 244 | 7669 | 85.5 | 452 | 437 | 84.6 |
| B | 0 | 87 | 6510 | 71.8 | 452 | 437 | 84.6 |
| C | 2 | 53 | 288057 | 2968.0 | 435 | 427 | 96.9 |
| C | 10 | 65 | 37234 | 379.8 | 435 | 427 | 96.9 |
| C | 8 | 112 | 14286 | 143.01 | 435 | 427 | 96.9 |
| D | 2 | 184 | 795491 | 7898.92 | 431 | 415 | 100.7 |
| D | 7 | 67 | 162841 | 1613.67 | 431 | 415 | 100.7 |
| D | 9 | 64 | 24313 | 237.42 | 431 | 415 | 100.7 |
Histogram calculated using DETX and DETY for each event in the final _common_clean file
| Quadrant A |  |
 |
Quadrant B |
|---|---|---|---|
| Quadrant D |  |
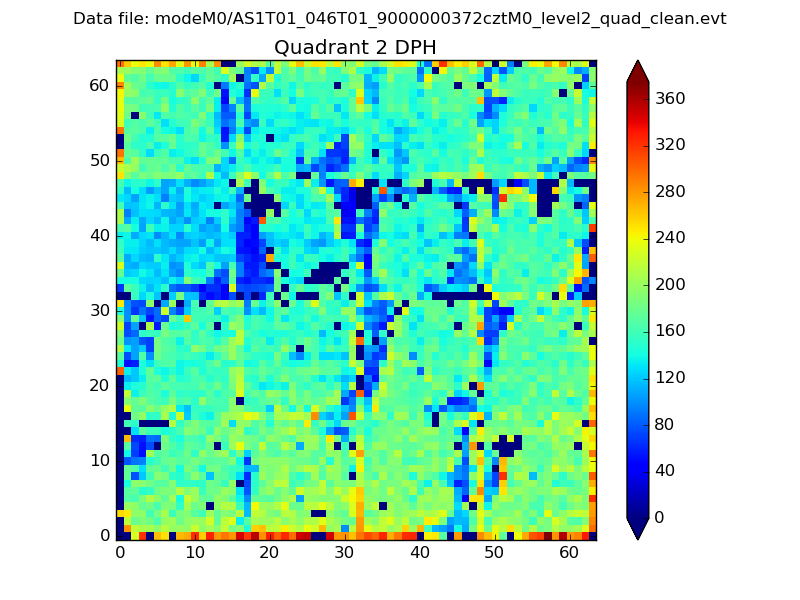 |
Quadrant C |
| Plot type | Count rate plots | Images |
|---|---|---|
| Comparison with Poisson distribution Blue bars denote a histogram of data divided into 1 sec bins. Red curve is a Poisson curve with rate = median count rate of data. |
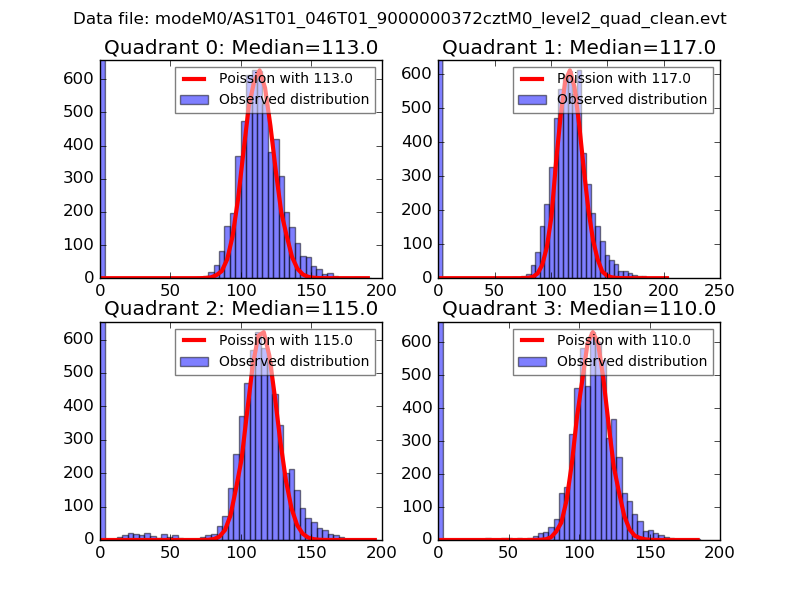 |
 |
| Quadrant-wise count rates Data is divided into 100 sec bins |
 |
|
| Module-wise count rates for Quadrant A Data is divided into 100 sec bins |
 |
 |
| Module-wise count rates for Quadrant B Data is divided into 100 sec bins |
 |
 |
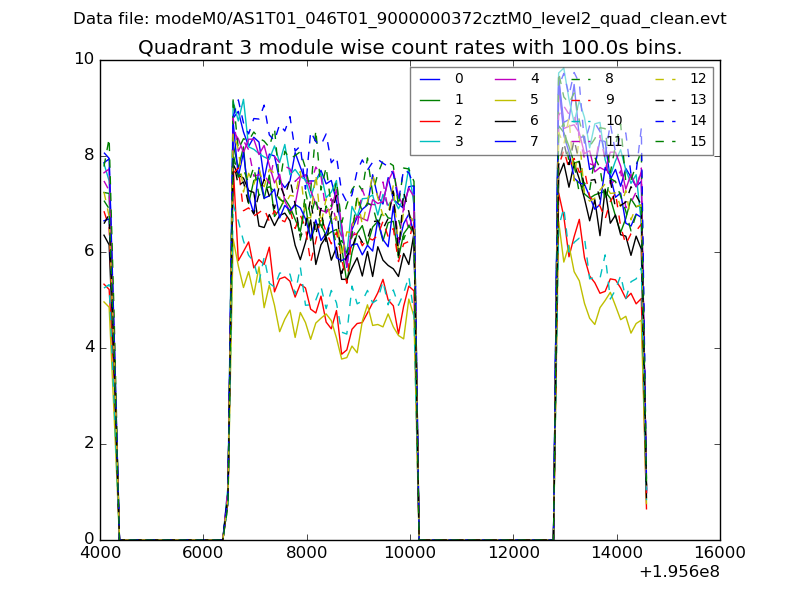
| Module-wise count rates for Quadrant C Data is divided into 100 sec bins |
 |
 |
| Module-wise count rates for Quadrant D Data is divided into 100 sec bins |
 |
 |
| Parameter | Plot |
|---|---|
| CZT HV Monitor |  |
| D_VDD |  |
| Temperature 1 |  |
| Veto HV Monitor |  |
| Veto LLD |  |
| Alpha Counter |  |
| _CPM_Rate |  |
| CZT Counter |  |
| +2.5 Volts monitor |  |
| +5 Volts monitor |  |
| _ROLL_ROT |  |
| _Roll_DEC |  |
| _Roll_RA |  |
| Veto Counter |  |