| Param | Original file | Final file |
|---|---|---|
| Filename | modeM0/AS1T01_031T01_9000000368cztM0_level2.evt | modeM0/AS1T01_031T01_9000000368cztM0_level2_quad_clean.evt |
| Size (bytes) | 1,473,526,080 | 269,176,320 |
| Size | 1.4 GB | 256.7 MB |
| Events in quadrant A | 10,069,758 | 1,683,669 |
| Events in quadrant B | 10,265,885 | 1,699,411 |
| Events in quadrant C | 9,958,536 | 1,656,947 |
| Events in quadrant D | 12,847,771 | 1,602,806 |
| Mode SS | |||
|---|---|---|---|
| Quadrant | BADHDUFLAG | Total packets | Discarded packets |
| A | 0 | 446 | 0 |
| B | 0 | 446 | 0 |
| C | 0 | 446 | 0 |
| D | 0 | 446 | 0 |
| Mode M0 | |||
|---|---|---|---|
| Quadrant | BADHDUFLAG | Total packets | Discarded packets |
| A | 0 | 45828 | 0 |
| B | 0 | 46193 | 0 |
| C | 0 | 45714 | 0 |
| D | 0 | 54456 | 0 |
| Mode M9 | |||
|---|---|---|---|
| Quadrant | BADHDUFLAG | Total packets | Discarded packets |
| A | 0 | 10 | 0 |
| B | 0 | 10 | 0 |
| C | 0 | 10 | 0 |
| D | 0 | 10 | 0 |
| Quadrant | Total seconds | Saturated seconds | Saturation percentage |
|---|---|---|---|
| A | 21934 | 623 | 2.840339% |
| B | 21934 | 645 | 2.940640% |
| C | 21934 | 284 | 1.294793% |
| D | 21934 | 1062 | 4.841798% |
Noise dominated data is calculated using 1-second bins in cleaned event files. If a bin has >2000 counts, and if more than 50% of those come from <1% of pixels, then it is considered to be noise-dominated and hence unusable.
| Quadrant | # 1 sec bins | Bins with >0 counts | Bins with >2000 counts | High rate bins dominated by noise | Noise dominated (total time) | Noise dominated (detector-on time) | Marked lightcurve |
|---|---|---|---|---|---|---|---|
| A | 22914 | 21940 | 0 | 0 | 0.00% | 0.00% |  |
| B | 22914 | 21940 | 25 | 25 | 0.11% | 0.11% | 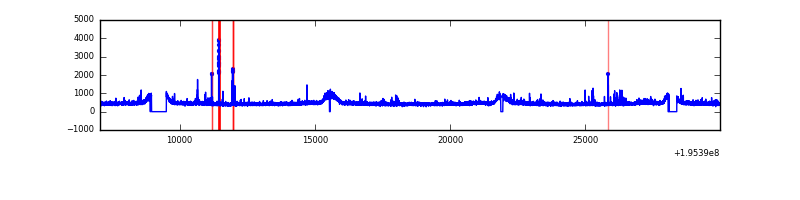 |
| C | 22914 | 21940 | 0 | 0 | 0.00% | 0.00% | 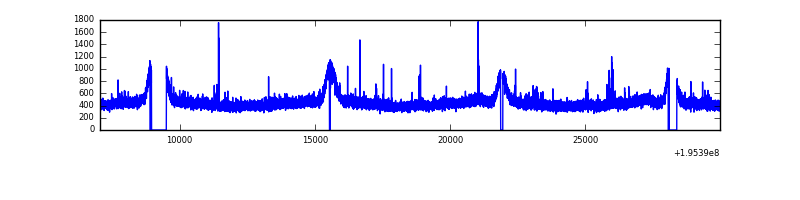 |
| D | 22914 | 21940 | 520 | 520 | 2.27% | 2.37% |  |
Top three noisy pixels from each quadrant. If the there are fewer than three noisy pixels in the level2.evt file, extra rows are filled as -1
| Pixel properties | Quadrant properties | ||||||
|---|---|---|---|---|---|---|---|
| Quadrant | DetID | PixID | Counts | Sigma | Mean | Median | Sigma |
| A | 8 | 15 | 130351 | 243.47 | 2563 | 2499 | 525.1 |
| A | 3 | 1 | 46741 | 84.25 | 2563 | 2499 | 525.1 |
| A | 12 | 194 | 28935 | 50.34 | 2563 | 2499 | 525.1 |
| B | 10 | 244 | 89353 | 173.68 | 2593 | 2523 | 499.9 |
| B | 5 | 172 | 68881 | 132.73 | 2593 | 2523 | 499.9 |
| B | 12 | 111 | 34775 | 64.51 | 2593 | 2523 | 499.9 |
| C | 2 | 53 | 46377 | 74.73 | 2498 | 2507 | 587.1 |
| C | 10 | 65 | 40024 | 63.91 | 2498 | 2507 | 587.1 |
| C | 8 | 112 | 33484 | 52.77 | 2498 | 2507 | 587.1 |
| D | 13 | 53 | 1287521 | 2213.5 | 2439 | 2382 | 580.6 |
| D | 7 | 67 | 883897 | 1518.31 | 2439 | 2382 | 580.6 |
| D | 13 | 169 | 503291 | 862.76 | 2439 | 2382 | 580.6 |
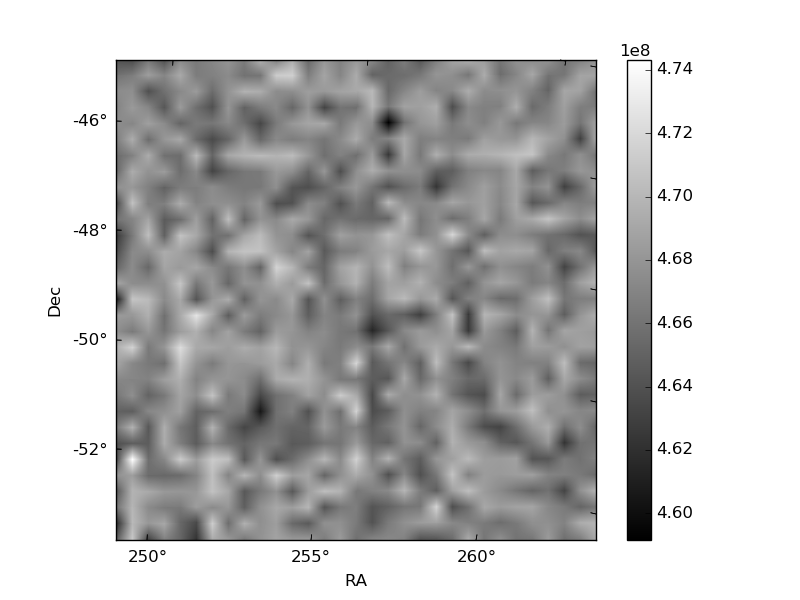
Histogram calculated using DETX and DETY for each event in the final _common_clean file
| Quadrant A | 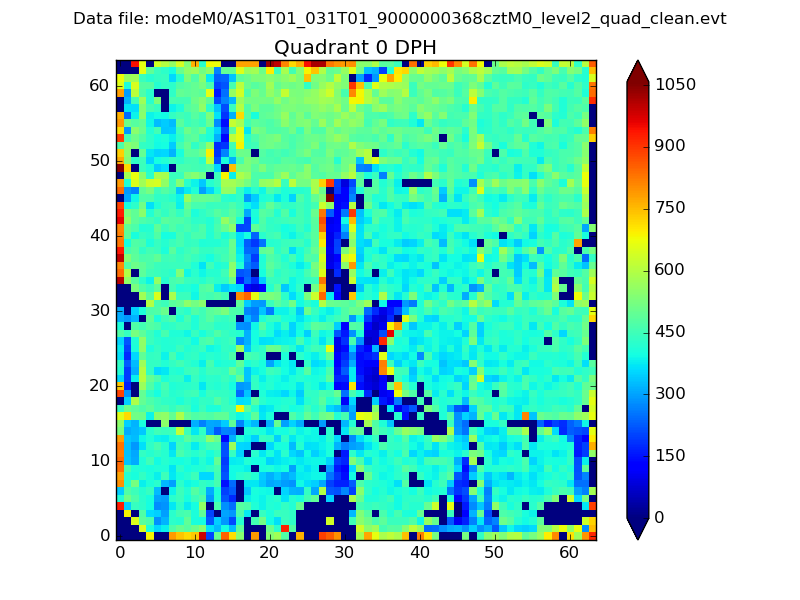 |
 |
Quadrant B |
|---|---|---|---|
| Quadrant D |  |
 |
Quadrant C |
| Plot type | Count rate plots | Images |
|---|---|---|
| Comparison with Poisson distribution Blue bars denote a histogram of data divided into 1 sec bins. Red curve is a Poisson curve with rate = median count rate of data. |
 |
 |
| Quadrant-wise count rates Data is divided into 100 sec bins |
 |
|
| Module-wise count rates for Quadrant A Data is divided into 100 sec bins |
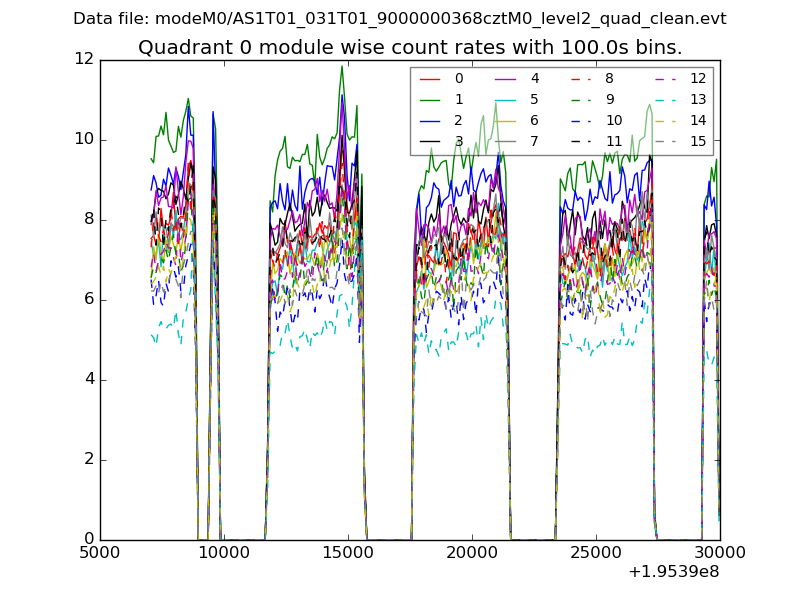 |
 |
| Module-wise count rates for Quadrant B Data is divided into 100 sec bins |
 |
 |
| Module-wise count rates for Quadrant C Data is divided into 100 sec bins |
 |
 |
| Module-wise count rates for Quadrant D Data is divided into 100 sec bins |
 |
 |
| Parameter | Plot |
|---|---|
| CZT HV Monitor |  |
| D_VDD |  |
| Temperature 1 |  |
| Veto HV Monitor |  |
| Veto LLD |  |
| Alpha Counter |  |
| _CPM_Rate |  |
| CZT Counter | 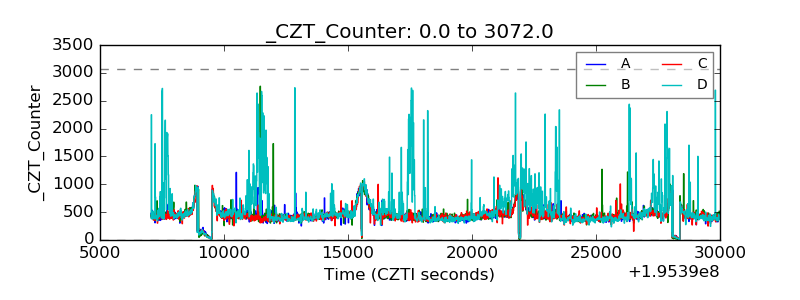 |
| +2.5 Volts monitor |  |
| +5 Volts monitor |  |
| _ROLL_ROT | 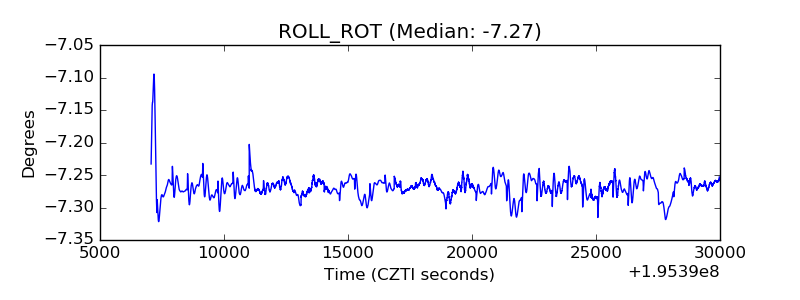 |
| _Roll_DEC |  |
| _Roll_RA |  |
| Veto Counter |  |