| Param | Original file | Final file |
|---|---|---|
| Filename | modeM0/AS1G02_018T06_9000000370cztM0_level2.evt | modeM0/AS1G02_018T06_9000000370cztM0_level2_quad_clean.evt |
| Size (bytes) | 9,590,080,320 | 1,708,773,120 |
| Size | 8.9 GB | 1.6 GB |
| Events in quadrant A | 67,733,766 | 10,374,247 |
| Events in quadrant B | 69,252,488 | 10,683,133 |
| Events in quadrant C | 74,138,132 | 10,452,571 |
| Events in quadrant D | 69,410,268 | 10,198,991 |
| Mode M9 | |||
|---|---|---|---|
| Quadrant | BADHDUFLAG | Total packets | Discarded packets |
| A | 0 | 213 | 0 |
| B | 0 | 213 | 0 |
| C | 0 | 213 | 0 |
| D | 0 | 213 | 0 |
| Mode M0 | |||
|---|---|---|---|
| Quadrant | BADHDUFLAG | Total packets | Discarded packets |
| A | 0 | 303859 | 0 |
| B | 0 | 304871 | 0 |
| C | 0 | 323853 | 0 |
| D | 0 | 314719 | 0 |
| Mode SS | |||
|---|---|---|---|
| Quadrant | BADHDUFLAG | Total packets | Discarded packets |
| A | 0 | 2994 | 0 |
| B | 0 | 2994 | 0 |
| C | 0 | 2994 | 0 |
| D | 0 | 2994 | 0 |
| Quadrant | Total seconds | Saturated seconds | Saturation percentage |
|---|---|---|---|
| A | 146638 | 1954 | 1.332533% |
| B | 146638 | 1907 | 1.300481% |
| C | 146638 | 3857 | 2.630287% |
| D | 146638 | 1979 | 1.349582% |
Noise dominated data is calculated using 1-second bins in cleaned event files. If a bin has >2000 counts, and if more than 50% of those come from <1% of pixels, then it is considered to be noise-dominated and hence unusable.
| Quadrant | # 1 sec bins | Bins with >0 counts | Bins with >2000 counts | High rate bins dominated by noise | Noise dominated (total time) | Noise dominated (detector-on time) | Marked lightcurve |
|---|---|---|---|---|---|---|---|
| A | 171445 | 146670 | 232 | 232 | 0.14% | 0.16% | 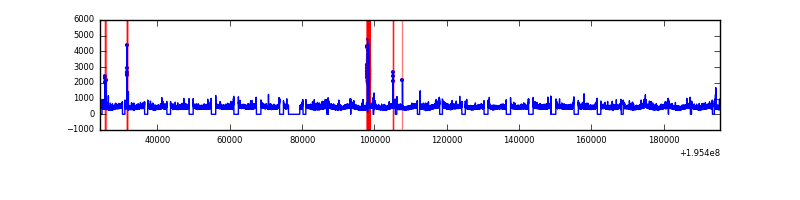 |
| B | 171445 | 146670 | 81 | 81 | 0.05% | 0.06% |  |
| C | 171445 | 146670 | 2215 | 2215 | 1.29% | 1.51% |  |
| D | 171445 | 146670 | 714 | 714 | 0.42% | 0.49% |  |
Top three noisy pixels from each quadrant. If the there are fewer than three noisy pixels in the level2.evt file, extra rows are filled as -1
| Pixel properties | Quadrant properties | ||||||
|---|---|---|---|---|---|---|---|
| Quadrant | DetID | PixID | Counts | Sigma | Mean | Median | Sigma |
| A | 8 | 192 | 759441 | 212.92 | 17165 | 16799 | 3487.8 |
| A | 8 | 15 | 700584 | 196.05 | 17165 | 16799 | 3487.8 |
| A | 12 | 194 | 192840 | 50.47 | 17165 | 16799 | 3487.8 |
| B | 10 | 244 | 426163 | 122.87 | 17510 | 17090 | 3329.4 |
| B | 4 | 48 | 350199 | 100.05 | 17510 | 17090 | 3329.4 |
| B | 4 | 200 | 271982 | 76.56 | 17510 | 17090 | 3329.4 |
| C | 2 | 53 | 5053722 | 1305.07 | 16616 | 16677 | 3859.6 |
| C | 14 | 223 | 2908701 | 749.3 | 16616 | 16677 | 3859.6 |
| C | 10 | 65 | 277050 | 67.46 | 16616 | 16677 | 3859.6 |
| D | 7 | 67 | 1542558 | 388.56 | 16590 | 16190 | 3928.2 |
| D | 12 | 33 | 763767 | 190.31 | 16590 | 16190 | 3928.2 |
| D | 13 | 53 | 732783 | 182.42 | 16590 | 16190 | 3928.2 |
Histogram calculated using DETX and DETY for each event in the final _common_clean file
| Quadrant A |  |
 |
Quadrant B |
|---|---|---|---|
| Quadrant D |  |
 |
Quadrant C |
| Plot type | Count rate plots | Images |
|---|---|---|
| Comparison with Poisson distribution Blue bars denote a histogram of data divided into 1 sec bins. Red curve is a Poisson curve with rate = median count rate of data. |
 |
 |
| Quadrant-wise count rates Data is divided into 100 sec bins |
 |
|
| Module-wise count rates for Quadrant A Data is divided into 100 sec bins |
 |
 |
| Module-wise count rates for Quadrant B Data is divided into 100 sec bins |
 |
 |
| Module-wise count rates for Quadrant C Data is divided into 100 sec bins |
 |
 |
| Module-wise count rates for Quadrant D Data is divided into 100 sec bins |
 |
 |
| Parameter | Plot |
|---|---|
| CZT HV Monitor |  |
| D_VDD |  |
| Temperature 1 |  |
| Veto HV Monitor |  |
| Veto LLD |  |
| Alpha Counter | 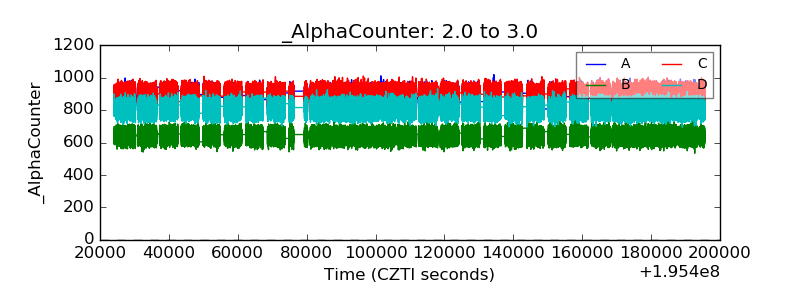 |
| _CPM_Rate |  |
| CZT Counter |  |
| +2.5 Volts monitor |  |
| +5 Volts monitor |  |
| _ROLL_ROT |  |
| _Roll_DEC |  |
| _Roll_RA |  |
| Veto Counter |  |