| Param | Original file | Final file |
|---|---|---|
| Filename | modeM0/AS1T01_045T01_9000000364cztM0_level2.evt | modeM0/AS1T01_045T01_9000000364cztM0_level2_quad_clean.evt |
| Size (bytes) | 2,283,491,520 | 318,948,480 |
| Size | 2.1 GB | 304.2 MB |
| Events in quadrant A | 15,026,107 | 1,938,238 |
| Events in quadrant B | 14,688,378 | 1,972,679 |
| Events in quadrant C | 20,691,194 | 1,906,398 |
| Events in quadrant D | 16,814,082 | 1,868,436 |
| Mode M9 | |||
|---|---|---|---|
| Quadrant | BADHDUFLAG | Total packets | Discarded packets |
| A | 0 | 27 | 0 |
| B | 0 | 27 | 0 |
| C | 0 | 27 | 0 |
| D | 0 | 27 | 0 |
| Mode M0 | |||
|---|---|---|---|
| Quadrant | BADHDUFLAG | Total packets | Discarded packets |
| A | 0 | 63898 | 0 |
| B | 0 | 63198 | 0 |
| C | 0 | 80904 | 0 |
| D | 0 | 70518 | 0 |
| Mode SS | |||
|---|---|---|---|
| Quadrant | BADHDUFLAG | Total packets | Discarded packets |
| A | 0 | 584 | 0 |
| B | 0 | 584 | 0 |
| C | 0 | 584 | 0 |
| D | 0 | 584 | 0 |
| Quadrant | Total seconds | Saturated seconds | Saturation percentage |
|---|---|---|---|
| A | 28699 | 870 | 3.031465% |
| B | 28699 | 836 | 2.912993% |
| C | 28699 | 1068 | 3.721384% |
| D | 28699 | 1368 | 4.766717% |
Noise dominated data is calculated using 1-second bins in cleaned event files. If a bin has >2000 counts, and if more than 50% of those come from <1% of pixels, then it is considered to be noise-dominated and hence unusable.
| Quadrant | # 1 sec bins | Bins with >0 counts | Bins with >2000 counts | High rate bins dominated by noise | Noise dominated (total time) | Noise dominated (detector-on time) | Marked lightcurve |
|---|---|---|---|---|---|---|---|
| A | 31584 | 28703 | 135 | 135 | 0.43% | 0.47% |  |
| B | 31584 | 28703 | 140 | 140 | 0.44% | 0.49% | 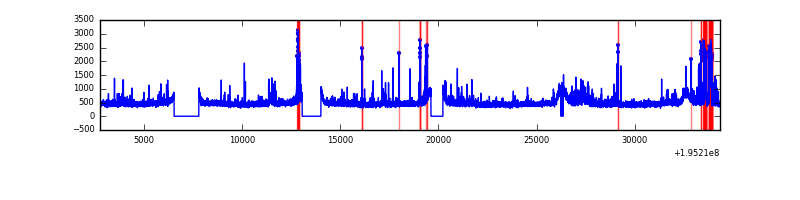 |
| C | 31584 | 28703 | 310 | 310 | 0.98% | 1.08% | 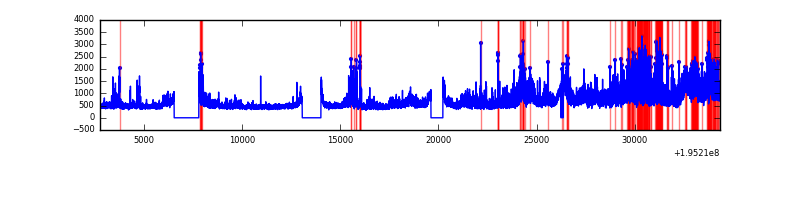 |
| D | 31584 | 28703 | 855 | 855 | 2.71% | 2.98% | 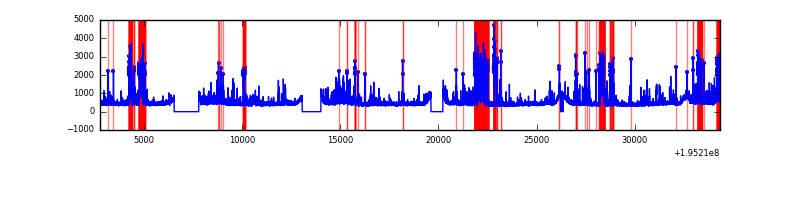 |
Top three noisy pixels from each quadrant. If the there are fewer than three noisy pixels in the level2.evt file, extra rows are filled as -1
| Pixel properties | Quadrant properties | ||||||
|---|---|---|---|---|---|---|---|
| Quadrant | DetID | PixID | Counts | Sigma | Mean | Median | Sigma |
| A | 8 | 14 | 1321782 | 1884.55 | 3420 | 3342 | 699.6 |
| A | 8 | 15 | 259639 | 366.35 | 3420 | 3342 | 699.6 |
| A | 3 | 1 | 214667 | 302.06 | 3420 | 3342 | 699.6 |
| B | 15 | 85 | 518899 | 783.37 | 3454 | 3368 | 658.1 |
| B | 6 | 36 | 272345 | 408.72 | 3454 | 3368 | 658.1 |
| B | 10 | 244 | 252668 | 378.82 | 3454 | 3368 | 658.1 |
| C | 5 | 234 | 7515438 | 9787.33 | 3298 | 3312 | 767.5 |
| C | 14 | 223 | 180723 | 231.14 | 3298 | 3312 | 767.5 |
| C | 10 | 82 | 66008 | 81.68 | 3298 | 3312 | 767.5 |
| D | 13 | 53 | 2424467 | 3105.48 | 3263 | 3183 | 779.7 |
| D | 7 | 67 | 543757 | 693.33 | 3263 | 3183 | 779.7 |
| D | 13 | 169 | 518160 | 660.5 | 3263 | 3183 | 779.7 |
Histogram calculated using DETX and DETY for each event in the final _common_clean file
| Quadrant A | 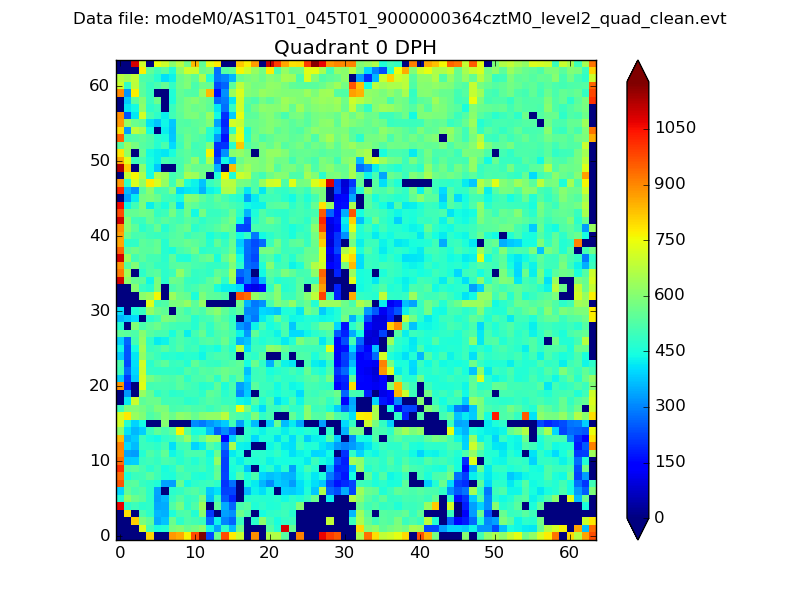 |
 |
Quadrant B |
|---|---|---|---|
| Quadrant D |  |
 |
Quadrant C |
| Plot type | Count rate plots | Images |
|---|---|---|
| Comparison with Poisson distribution Blue bars denote a histogram of data divided into 1 sec bins. Red curve is a Poisson curve with rate = median count rate of data. |
 |
 |
| Quadrant-wise count rates Data is divided into 100 sec bins |
 |
|
| Module-wise count rates for Quadrant A Data is divided into 100 sec bins |
 |
 |
| Module-wise count rates for Quadrant B Data is divided into 100 sec bins |
 |
 |
| Module-wise count rates for Quadrant C Data is divided into 100 sec bins |
 |
 |
| Module-wise count rates for Quadrant D Data is divided into 100 sec bins |
 |
 |
| Parameter | Plot |
|---|---|
| CZT HV Monitor |  |
| D_VDD |  |
| Temperature 1 |  |
| Veto HV Monitor |  |
| Veto LLD |  |
| Alpha Counter | 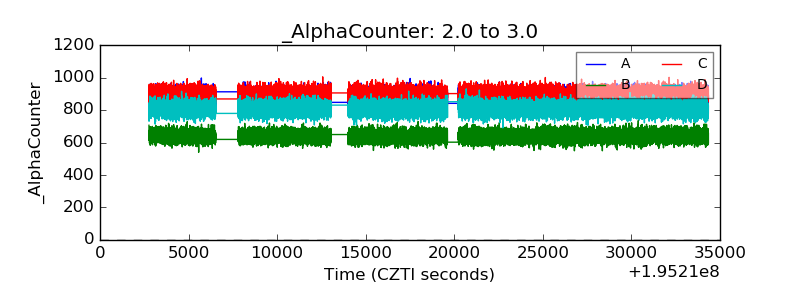 |
| _CPM_Rate |  |
| CZT Counter |  |
| +2.5 Volts monitor |  |
| +5 Volts monitor | 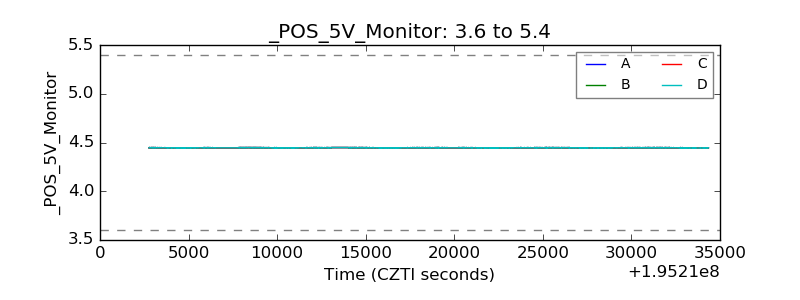 |
| _ROLL_ROT |  |
| _Roll_DEC |  |
| _Roll_RA |  |
| Veto Counter |  |