| Param | Original file | Final file |
|---|---|---|
| Filename | modeM0/AS1T01_042T01_9000000366cztM0_level2.evt | modeM0/AS1T01_042T01_9000000366cztM0_level2_quad_clean.evt |
| Size (bytes) | 8,118,227,520 | 1,378,319,040 |
| Size | 7.6 GB | 1.3 GB |
| Events in quadrant A | 60,541,807 | 8,530,011 |
| Events in quadrant B | 56,239,160 | 8,691,562 |
| Events in quadrant C | 59,060,359 | 8,449,051 |
| Events in quadrant D | 62,174,849 | 8,107,369 |
| Mode M9 | |||
|---|---|---|---|
| Quadrant | BADHDUFLAG | Total packets | Discarded packets |
| A | 0 | 193 | 0 |
| B | 0 | 193 | 0 |
| C | 0 | 193 | 0 |
| D | 0 | 193 | 0 |
| Mode SS | |||
|---|---|---|---|
| Quadrant | BADHDUFLAG | Total packets | Discarded packets |
| A | 0 | 2374 | 0 |
| B | 0 | 2374 | 0 |
| C | 0 | 2374 | 0 |
| D | 0 | 2374 | 0 |
| Mode M0 | |||
|---|---|---|---|
| Quadrant | BADHDUFLAG | Total packets | Discarded packets |
| A | 0 | 258256 | 0 |
| B | 0 | 244808 | 0 |
| C | 0 | 254689 | 0 |
| D | 0 | 267567 | 0 |
| Quadrant | Total seconds | Saturated seconds | Saturation percentage |
|---|---|---|---|
| A | 116266 | 3063 | 2.634476% |
| B | 116312 | 1528 | 1.313708% |
| C | 116288 | 1829 | 1.572819% |
| D | 116288 | 3111 | 2.675255% |
Noise dominated data is calculated using 1-second bins in cleaned event files. If a bin has >2000 counts, and if more than 50% of those come from <1% of pixels, then it is considered to be noise-dominated and hence unusable.
| Quadrant | # 1 sec bins | Bins with >0 counts | Bins with >2000 counts | High rate bins dominated by noise | Noise dominated (total time) | Noise dominated (detector-on time) | Marked lightcurve |
|---|---|---|---|---|---|---|---|
| A | 135758 | 116293 | 1276 | 1276 | 0.94% | 1.10% |  |
| B | 135758 | 116339 | 101 | 101 | 0.07% | 0.09% |  |
| C | 135758 | 116316 | 678 | 678 | 0.50% | 0.58% | 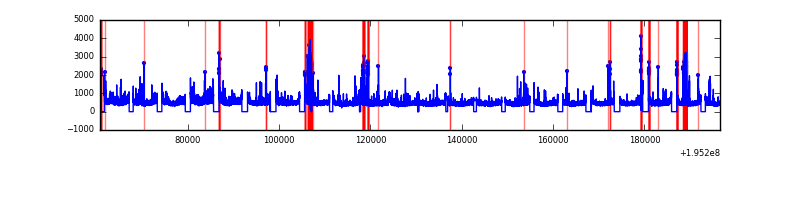 |
| D | 135758 | 116314 | 1658 | 1658 | 1.22% | 1.43% |  |
Top three noisy pixels from each quadrant. If the there are fewer than three noisy pixels in the level2.evt file, extra rows are filled as -1
| Pixel properties | Quadrant properties | ||||||
|---|---|---|---|---|---|---|---|
| Quadrant | DetID | PixID | Counts | Sigma | Mean | Median | Sigma |
| A | 15 | 236 | 3455425 | 1234.49 | 13732 | 13431 | 2788.2 |
| A | 8 | 14 | 2776502 | 990.99 | 13732 | 13431 | 2788.2 |
| A | 8 | 15 | 676426 | 237.79 | 13732 | 13431 | 2788.2 |
| B | 4 | 200 | 505940 | 185.9 | 13955 | 13611 | 2648.4 |
| B | 15 | 85 | 480688 | 176.36 | 13955 | 13611 | 2648.4 |
| B | 10 | 244 | 396728 | 144.66 | 13955 | 13611 | 2648.4 |
| C | 5 | 234 | 3428800 | 1089.66 | 13376 | 13434 | 3134.3 |
| C | 2 | 53 | 2326990 | 738.13 | 13376 | 13434 | 3134.3 |
| C | 14 | 223 | 441903 | 136.7 | 13376 | 13434 | 3134.3 |
| D | 13 | 53 | 4598754 | 1461.36 | 13218 | 12926 | 3138.1 |
| D | 7 | 67 | 3257810 | 1034.04 | 13218 | 12926 | 3138.1 |
| D | 0 | 96 | 893179 | 280.51 | 13218 | 12926 | 3138.1 |
Histogram calculated using DETX and DETY for each event in the final _common_clean file
| Quadrant A | 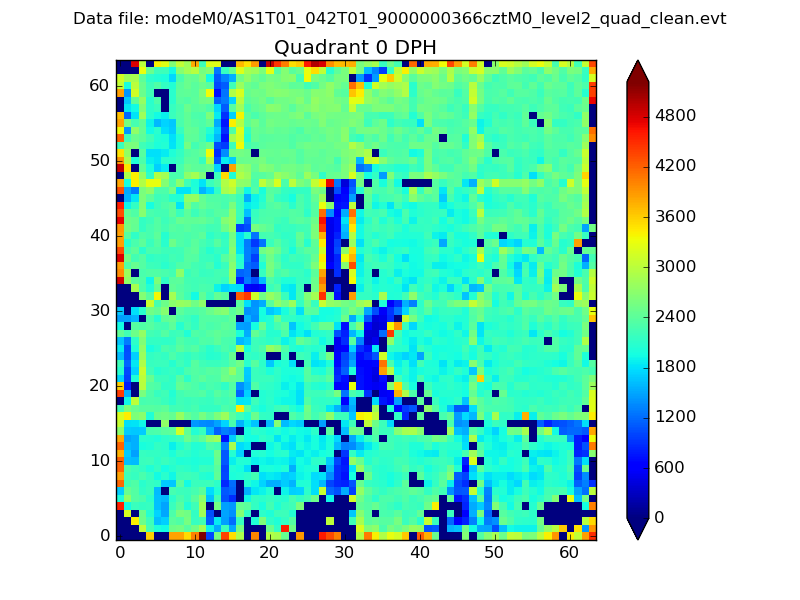 |
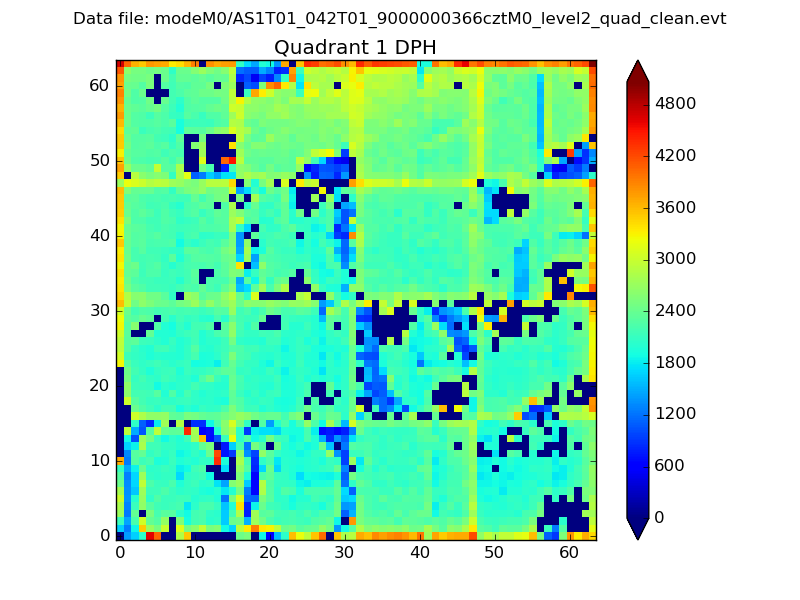 |
Quadrant B |
|---|---|---|---|
| Quadrant D | 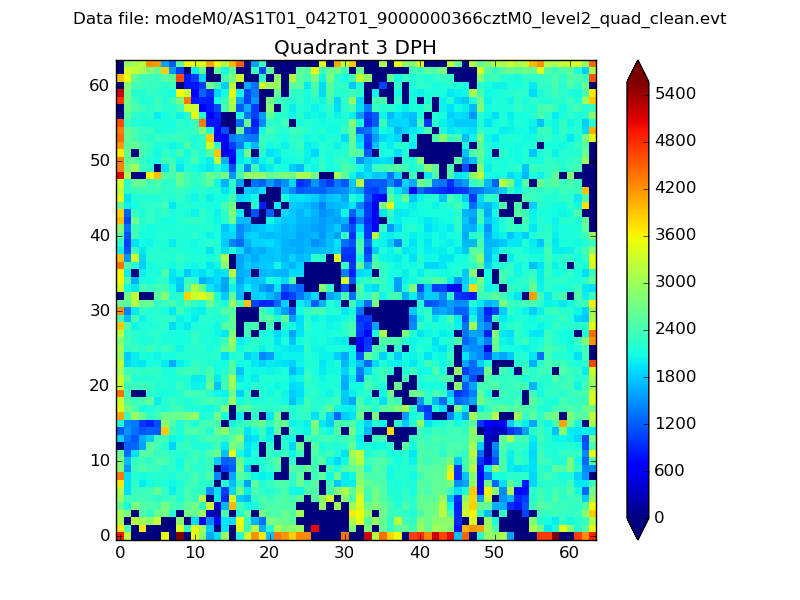 |
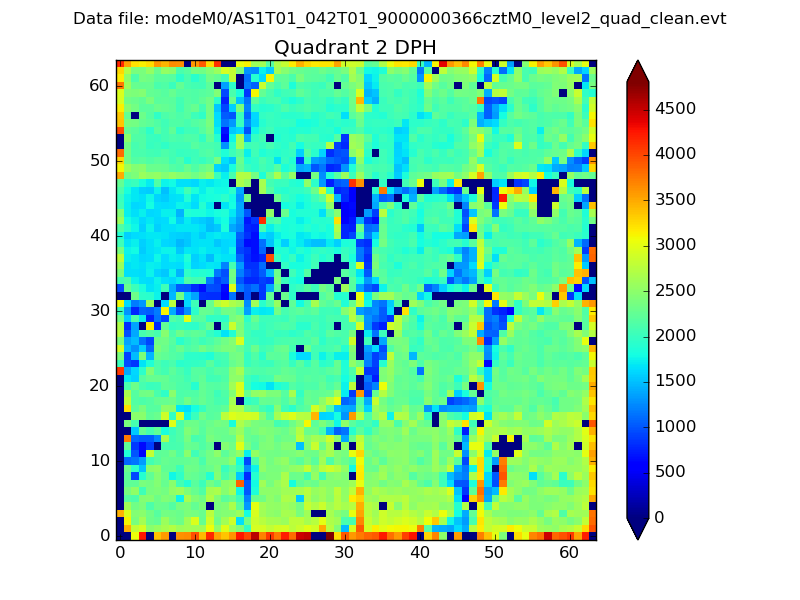 |
Quadrant C |
| Plot type | Count rate plots | Images |
|---|---|---|
| Comparison with Poisson distribution Blue bars denote a histogram of data divided into 1 sec bins. Red curve is a Poisson curve with rate = median count rate of data. |
 |
 |
| Quadrant-wise count rates Data is divided into 100 sec bins |
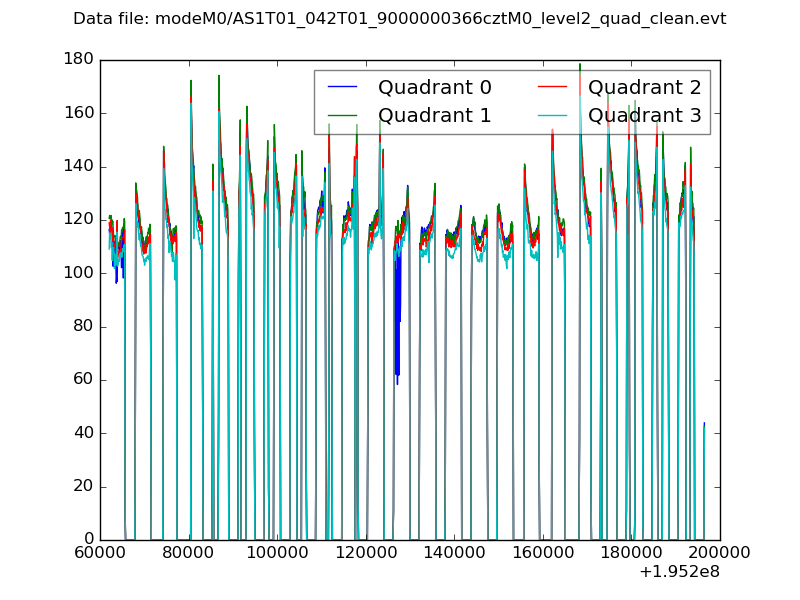 |
|
| Module-wise count rates for Quadrant A Data is divided into 100 sec bins |
 |
 |
| Module-wise count rates for Quadrant B Data is divided into 100 sec bins |
 |
 |
| Module-wise count rates for Quadrant C Data is divided into 100 sec bins |
 |
 |
| Module-wise count rates for Quadrant D Data is divided into 100 sec bins |
 |
 |
| Parameter | Plot |
|---|---|
| CZT HV Monitor |  |
| D_VDD |  |
| Temperature 1 |  |
| Veto HV Monitor |  |
| Veto LLD |  |
| Alpha Counter |  |
| _CPM_Rate |  |
| CZT Counter |  |
| +2.5 Volts monitor |  |
| +5 Volts monitor | 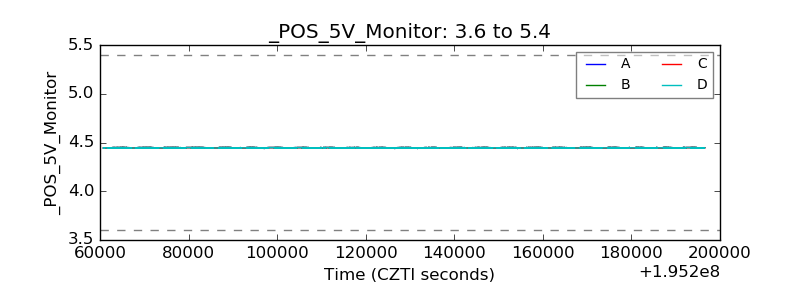 |
| _ROLL_ROT | 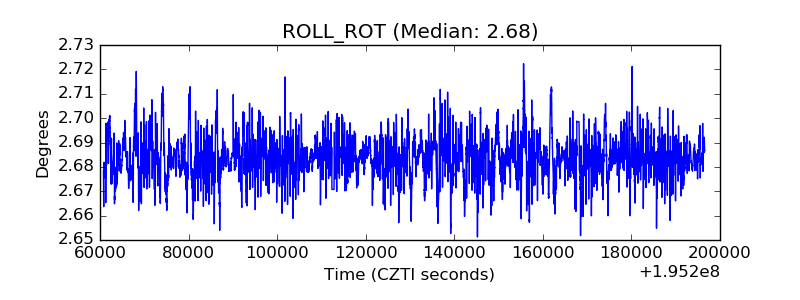 |
| _Roll_DEC |  |
| _Roll_RA |  |
| Veto Counter |  |