| Param | Original file | Final file |
|---|---|---|
| Filename | modeM0/AS1T01_041T01_9000000362cztM0_level2.evt | modeM0/AS1T01_041T01_9000000362cztM0_level2_quad_clean.evt |
| Size (bytes) | 9,794,718,720 | 1,498,910,400 |
| Size | 9.1 GB | 1.4 GB |
| Events in quadrant A | 69,577,922 | 9,150,016 |
| Events in quadrant B | 63,055,301 | 9,389,849 |
| Events in quadrant C | 66,123,075 | 9,212,773 |
| Events in quadrant D | 89,188,567 | 8,814,967 |
| Mode M9 | |||
|---|---|---|---|
| Quadrant | BADHDUFLAG | Total packets | Discarded packets |
| A | 0 | 177 | 0 |
| B | 0 | 177 | 0 |
| C | 0 | 177 | 0 |
| D | 0 | 177 | 0 |
| Mode SS | |||
|---|---|---|---|
| Quadrant | BADHDUFLAG | Total packets | Discarded packets |
| A | 0 | 2626 | 0 |
| B | 0 | 2626 | 0 |
| C | 0 | 2626 | 0 |
| D | 0 | 2626 | 0 |
| Mode M0 | |||
|---|---|---|---|
| Quadrant | BADHDUFLAG | Total packets | Discarded packets |
| A | 0 | 294467 | 0 |
| B | 0 | 276026 | 0 |
| C | 0 | 285082 | 0 |
| D | 0 | 357342 | 0 |
| Quadrant | Total seconds | Saturated seconds | Saturation percentage |
|---|---|---|---|
| A | 128888 | 3889 | 3.017348% |
| B | 128888 | 2258 | 1.751909% |
| C | 128888 | 2498 | 1.938117% |
| D | 128887 | 11604 | 9.003235% |
Noise dominated data is calculated using 1-second bins in cleaned event files. If a bin has >2000 counts, and if more than 50% of those come from <1% of pixels, then it is considered to be noise-dominated and hence unusable.
| Quadrant | # 1 sec bins | Bins with >0 counts | Bins with >2000 counts | High rate bins dominated by noise | Noise dominated (total time) | Noise dominated (detector-on time) | Marked lightcurve |
|---|---|---|---|---|---|---|---|
| A | 146810 | 128910 | 1957 | 1957 | 1.33% | 1.52% |  |
| B | 146810 | 128910 | 433 | 433 | 0.29% | 0.34% |  |
| C | 146810 | 128910 | 1415 | 1415 | 0.96% | 1.10% |  |
| D | 146810 | 128909 | 7820 | 7820 | 5.33% | 6.07% |  |
Top three noisy pixels from each quadrant. If the there are fewer than three noisy pixels in the level2.evt file, extra rows are filled as -1
| Pixel properties | Quadrant properties | ||||||
|---|---|---|---|---|---|---|---|
| Quadrant | DetID | PixID | Counts | Sigma | Mean | Median | Sigma |
| A | 15 | 143 | 5397824 | 1777.55 | 14964 | 14653 | 3028.4 |
| A | 8 | 14 | 3184962 | 1046.85 | 14964 | 14653 | 3028.4 |
| A | 15 | 236 | 1283364 | 418.93 | 14964 | 14653 | 3028.4 |
| B | 6 | 36 | 1657509 | 567.21 | 15238 | 14852 | 2896.0 |
| B | 14 | 167 | 576620 | 193.98 | 15238 | 14852 | 2896.0 |
| B | 4 | 48 | 481726 | 161.21 | 15238 | 14852 | 2896.0 |
| C | 5 | 234 | 7503857 | 2204.48 | 14640 | 14710 | 3397.2 |
| C | 14 | 223 | 633281 | 182.08 | 14640 | 14710 | 3397.2 |
| C | 1 | 192 | 208009 | 56.9 | 14640 | 14710 | 3397.2 |
| D | 9 | 66 | 28955241 | 8600.01 | 14126 | 13792 | 3365.3 |
| D | 13 | 53 | 1908288 | 562.95 | 14126 | 13792 | 3365.3 |
| D | 13 | 169 | 996564 | 292.03 | 14126 | 13792 | 3365.3 |
Histogram calculated using DETX and DETY for each event in the final _common_clean file
| Quadrant A |  |
 |
Quadrant B |
|---|---|---|---|
| Quadrant D |  |
 |
Quadrant C |
| Plot type | Count rate plots | Images |
|---|---|---|
| Comparison with Poisson distribution Blue bars denote a histogram of data divided into 1 sec bins. Red curve is a Poisson curve with rate = median count rate of data. |
 |
 |
| Quadrant-wise count rates Data is divided into 100 sec bins |
 |
|
| Module-wise count rates for Quadrant A Data is divided into 100 sec bins |
 |
 |
| Module-wise count rates for Quadrant B Data is divided into 100 sec bins |
 |
 |
| Module-wise count rates for Quadrant C Data is divided into 100 sec bins |
 |
 |
| Module-wise count rates for Quadrant D Data is divided into 100 sec bins |
 |
 |
| Parameter | Plot |
|---|---|
| CZT HV Monitor |  |
| D_VDD |  |
| Temperature 1 |  |
| Veto HV Monitor |  |
| Veto LLD | 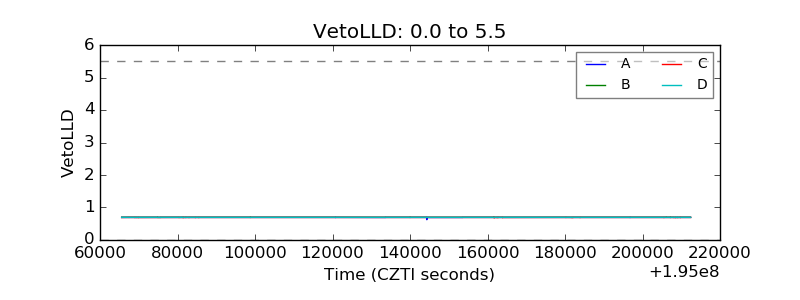 |
| Alpha Counter |  |
| _CPM_Rate |  |
| CZT Counter |  |
| +2.5 Volts monitor |  |
| +5 Volts monitor | 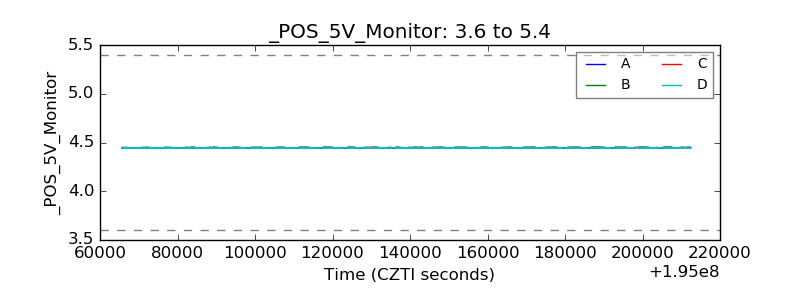 |
| _ROLL_ROT |  |
| _Roll_DEC |  |
| _Roll_RA |  |
| Veto Counter |  |