| Param | Original file | Final file |
|---|---|---|
| Filename | modeM0/AS1T01_028T01_9000000360cztM0_level2.evt | modeM0/AS1T01_028T01_9000000360cztM0_level2_quad_clean.evt |
| Size (bytes) | 3,634,830,720 | 633,553,920 |
| Size | 3.4 GB | 604.2 MB |
| Events in quadrant A | 24,450,265 | 3,885,632 |
| Events in quadrant B | 24,754,500 | 3,991,355 |
| Events in quadrant C | 23,923,111 | 3,954,255 |
| Events in quadrant D | 33,411,724 | 3,758,128 |
| Mode SS | |||
|---|---|---|---|
| Quadrant | BADHDUFLAG | Total packets | Discarded packets |
| A | 0 | 1070 | 0 |
| B | 0 | 1070 | 0 |
| C | 0 | 1070 | 0 |
| D | 0 | 1070 | 0 |
| Mode M9 | |||
|---|---|---|---|
| Quadrant | BADHDUFLAG | Total packets | Discarded packets |
| A | 0 | 96 | 0 |
| B | 0 | 96 | 0 |
| C | 0 | 96 | 0 |
| D | 0 | 96 | 0 |
| Mode M0 | |||
|---|---|---|---|
| Quadrant | BADHDUFLAG | Total packets | Discarded packets |
| A | 0 | 110093 | 0 |
| B | 0 | 110262 | 0 |
| C | 0 | 108533 | 0 |
| D | 0 | 136782 | 0 |
| Quadrant | Total seconds | Saturated seconds | Saturation percentage |
|---|---|---|---|
| A | 52470 | 762 | 1.452258% |
| B | 52470 | 742 | 1.414141% |
| C | 52470 | 507 | 0.966266% |
| D | 52470 | 2440 | 4.650276% |
Noise dominated data is calculated using 1-second bins in cleaned event files. If a bin has >2000 counts, and if more than 50% of those come from <1% of pixels, then it is considered to be noise-dominated and hence unusable.
| Quadrant | # 1 sec bins | Bins with >0 counts | Bins with >2000 counts | High rate bins dominated by noise | Noise dominated (total time) | Noise dominated (detector-on time) | Marked lightcurve |
|---|---|---|---|---|---|---|---|
| A | 93546 | 52484 | 115 | 115 | 0.12% | 0.22% | 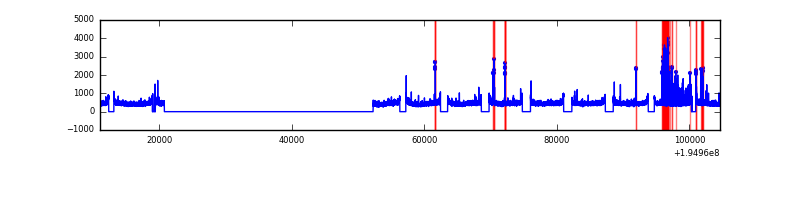 |
| B | 93546 | 52484 | 146 | 146 | 0.16% | 0.28% |  |
| C | 93546 | 52484 | 55 | 55 | 0.06% | 0.10% | 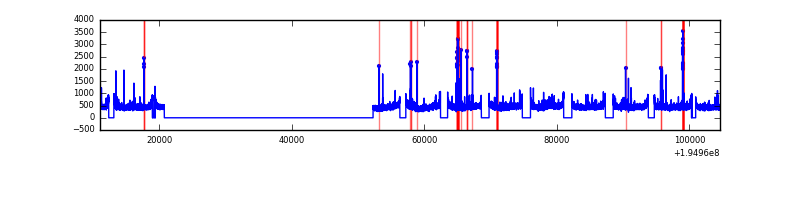 |
| D | 93546 | 52484 | 1461 | 1461 | 1.56% | 2.78% |  |
Top three noisy pixels from each quadrant. If the there are fewer than three noisy pixels in the level2.evt file, extra rows are filled as -1
| Pixel properties | Quadrant properties | ||||||
|---|---|---|---|---|---|---|---|
| Quadrant | DetID | PixID | Counts | Sigma | Mean | Median | Sigma |
| A | 15 | 143 | 563037 | 461.16 | 6041 | 5927 | 1208.1 |
| A | 8 | 14 | 273668 | 221.63 | 6041 | 5927 | 1208.1 |
| A | 15 | 236 | 222911 | 179.61 | 6041 | 5927 | 1208.1 |
| B | 6 | 36 | 312318 | 266.88 | 6108 | 5958 | 1147.9 |
| B | 5 | 232 | 261663 | 222.75 | 6108 | 5958 | 1147.9 |
| B | 10 | 244 | 215943 | 182.92 | 6108 | 5958 | 1147.9 |
| C | 5 | 234 | 625032 | 456.25 | 5882 | 5909 | 1357.0 |
| C | 14 | 223 | 112641 | 78.65 | 5882 | 5909 | 1357.0 |
| C | 1 | 3 | 72148 | 48.81 | 5882 | 5909 | 1357.0 |
| D | 9 | 66 | 9541880 | 6999.74 | 5763 | 5626 | 1362.4 |
| D | 13 | 169 | 1168321 | 853.43 | 5763 | 5626 | 1362.4 |
| D | 7 | 67 | 205151 | 146.45 | 5763 | 5626 | 1362.4 |
Histogram calculated using DETX and DETY for each event in the final _common_clean file
| Quadrant A |  |
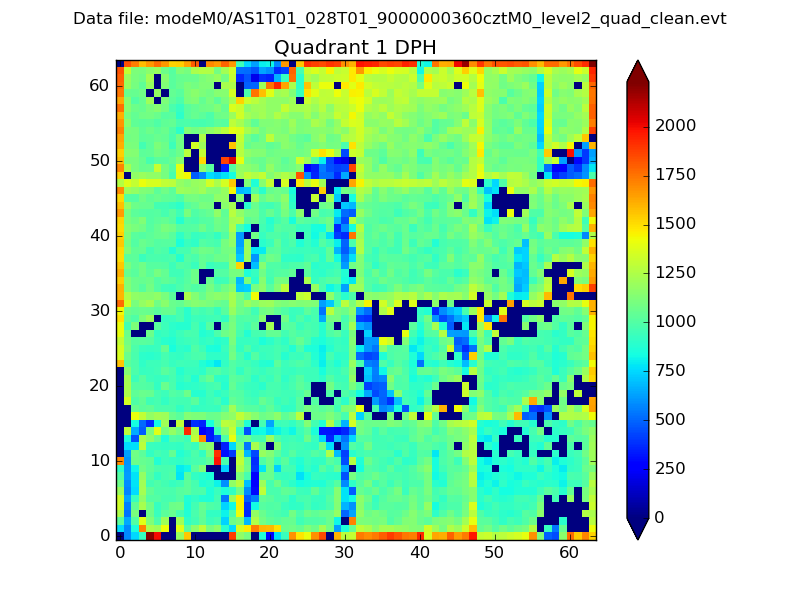 |
Quadrant B |
|---|---|---|---|
| Quadrant D |  |
 |
Quadrant C |
| Plot type | Count rate plots | Images |
|---|---|---|
| Comparison with Poisson distribution Blue bars denote a histogram of data divided into 1 sec bins. Red curve is a Poisson curve with rate = median count rate of data. |
 |
 |
| Quadrant-wise count rates Data is divided into 100 sec bins |
 |
|
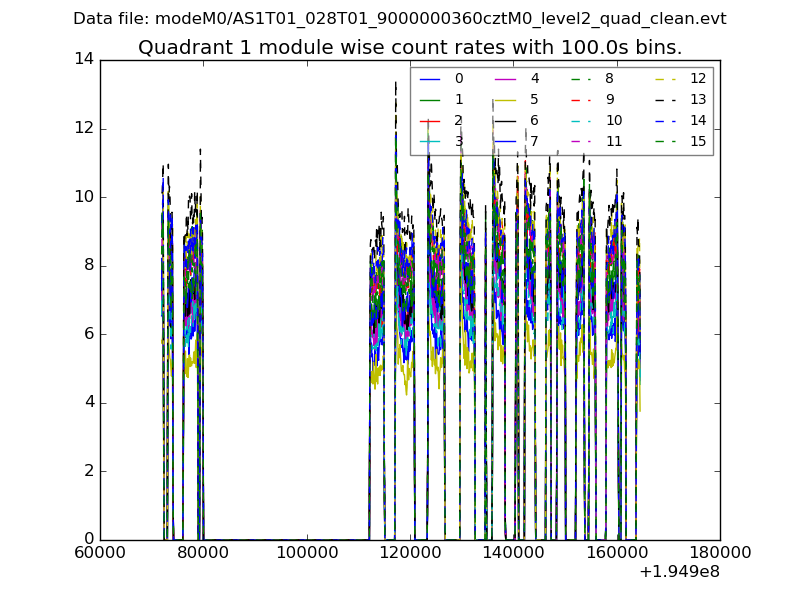
| Module-wise count rates for Quadrant A Data is divided into 100 sec bins |
 |
 |
| Module-wise count rates for Quadrant B Data is divided into 100 sec bins |
 |
 |
| Module-wise count rates for Quadrant C Data is divided into 100 sec bins |
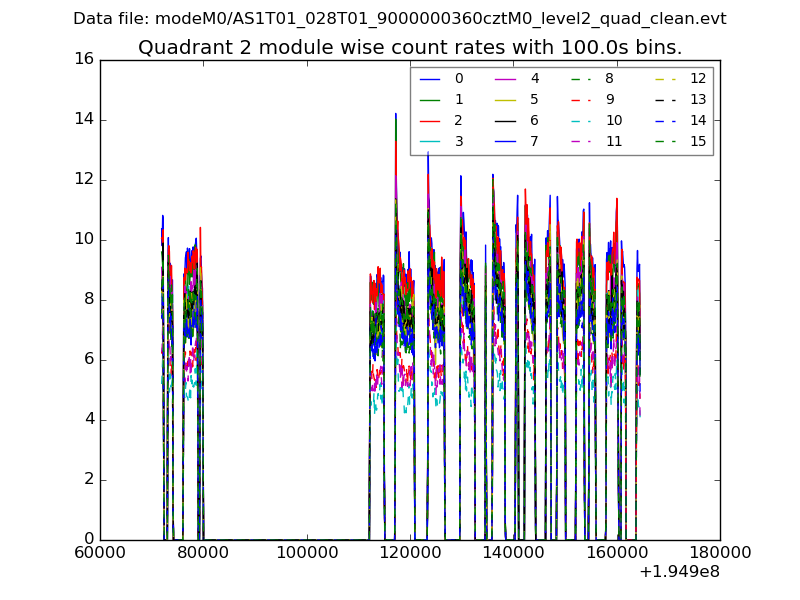 |
 |
| Module-wise count rates for Quadrant D Data is divided into 100 sec bins |
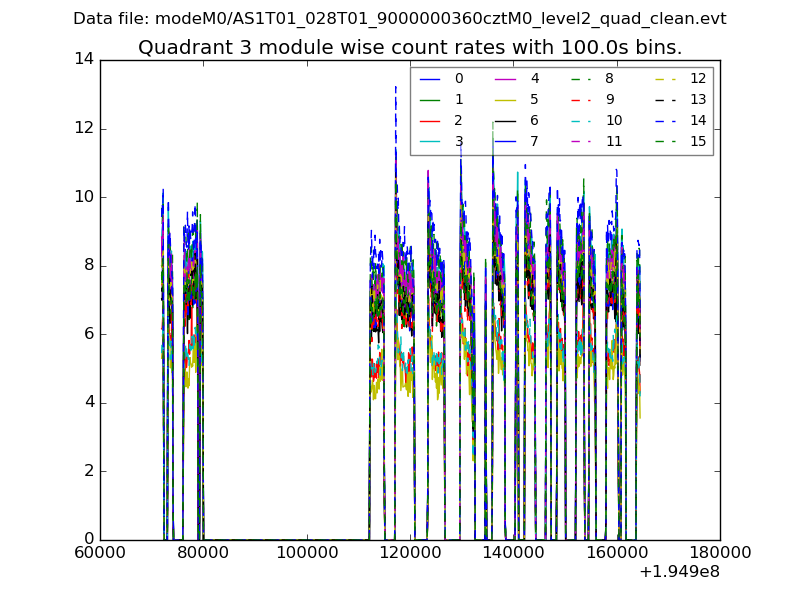 |
 |
| Parameter | Plot |
|---|---|
| CZT HV Monitor |  |
| D_VDD | 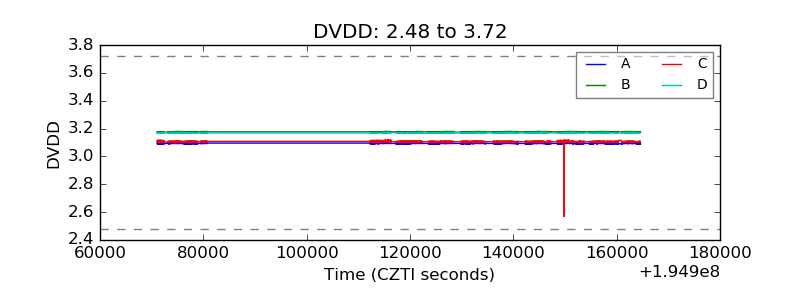 |
| Temperature 1 |  |
| Veto HV Monitor |  |
| Veto LLD | 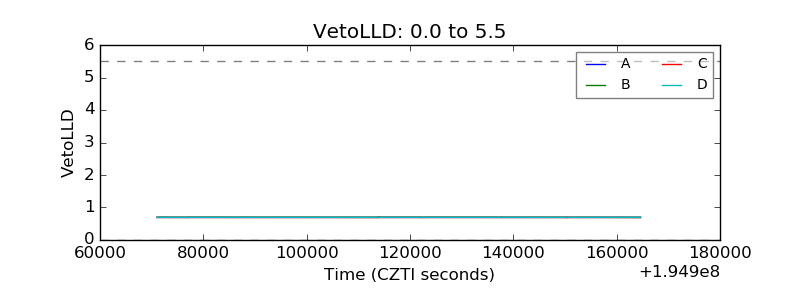 |
| Alpha Counter |  |
| _CPM_Rate |  |
| CZT Counter |  |
| +2.5 Volts monitor |  |
| +5 Volts monitor |  |
| _ROLL_ROT |  |
| _Roll_DEC |  |
| _Roll_RA |  |
| Veto Counter |  |