| Param | Original file | Final file |
|---|---|---|
| Filename | modeM0/AS1T01_030T01_9000000358cztM0_level2.evt | modeM0/AS1T01_030T01_9000000358cztM0_level2_quad_clean.evt |
| Size (bytes) | 10,267,007,040 | 1,790,389,440 |
| Size | 9.6 GB | 1.7 GB |
| Events in quadrant A | 77,321,590 | 11,031,832 |
| Events in quadrant B | 74,486,339 | 11,324,990 |
| Events in quadrant C | 73,388,680 | 10,996,159 |
| Events in quadrant D | 75,553,655 | 10,531,554 |
| Mode SS | |||
|---|---|---|---|
| Quadrant | BADHDUFLAG | Total packets | Discarded packets |
| A | 0 | 3068 | 0 |
| B | 0 | 3068 | 0 |
| C | 0 | 3068 | 0 |
| D | 0 | 3068 | 0 |
| Mode M0 | |||
|---|---|---|---|
| Quadrant | BADHDUFLAG | Total packets | Discarded packets |
| A | 0 | 330224 | 0 |
| B | 0 | 320798 | 0 |
| C | 0 | 320345 | 0 |
| D | 0 | 333669 | 0 |
| Mode M9 | |||
|---|---|---|---|
| Quadrant | BADHDUFLAG | Total packets | Discarded packets |
| A | 0 | 220 | 0 |
| B | 0 | 220 | 0 |
| C | 0 | 220 | 0 |
| D | 0 | 220 | 0 |
| Quadrant | Total seconds | Saturated seconds | Saturation percentage |
|---|---|---|---|
| A | 150991 | 2791 | 1.848455% |
| B | 150993 | 2537 | 1.680210% |
| C | 150993 | 1926 | 1.275556% |
| D | 150992 | 2735 | 1.811354% |
Noise dominated data is calculated using 1-second bins in cleaned event files. If a bin has >2000 counts, and if more than 50% of those come from <1% of pixels, then it is considered to be noise-dominated and hence unusable.
| Quadrant | # 1 sec bins | Bins with >0 counts | Bins with >2000 counts | High rate bins dominated by noise | Noise dominated (total time) | Noise dominated (detector-on time) | Marked lightcurve |
|---|---|---|---|---|---|---|---|
| A | 183940 | 151026 | 554 | 554 | 0.30% | 0.37% | 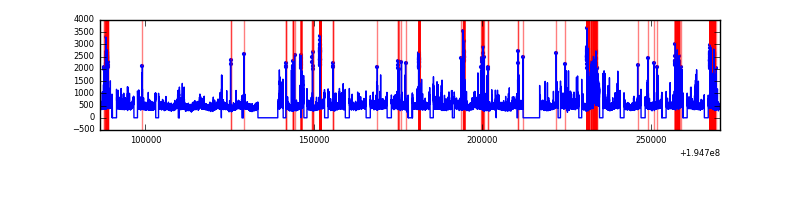 |
| B | 183940 | 151027 | 306 | 306 | 0.17% | 0.20% |  |
| C | 183940 | 151027 | 265 | 265 | 0.14% | 0.18% |  |
| D | 183940 | 151026 | 1114 | 1114 | 0.61% | 0.74% |  |
Top three noisy pixels from each quadrant. If the there are fewer than three noisy pixels in the level2.evt file, extra rows are filled as -1
| Pixel properties | Quadrant properties | ||||||
|---|---|---|---|---|---|---|---|
| Quadrant | DetID | PixID | Counts | Sigma | Mean | Median | Sigma |
| A | 8 | 14 | 4468086 | 1223.06 | 18086 | 17726 | 3638.7 |
| A | 14 | 235 | 966924 | 260.86 | 18086 | 17726 | 3638.7 |
| A | 3 | 1 | 568747 | 151.43 | 18086 | 17726 | 3638.7 |
| B | 6 | 36 | 1018076 | 289.11 | 18353 | 17961 | 3459.3 |
| B | 4 | 48 | 926197 | 262.55 | 18353 | 17961 | 3459.3 |
| B | 8 | 3 | 406970 | 112.45 | 18353 | 17961 | 3459.3 |
| C | 5 | 234 | 1678279 | 410.05 | 17543 | 17683 | 4049.7 |
| C | 7 | 220 | 1034789 | 251.16 | 17543 | 17683 | 4049.7 |
| C | 14 | 223 | 517520 | 123.43 | 17543 | 17683 | 4049.7 |
| D | 2 | 216 | 3014097 | 716.33 | 17429 | 17019 | 4184.0 |
| D | 1 | 20 | 2412493 | 572.54 | 17429 | 17019 | 4184.0 |
| D | 9 | 66 | 1284525 | 302.94 | 17429 | 17019 | 4184.0 |
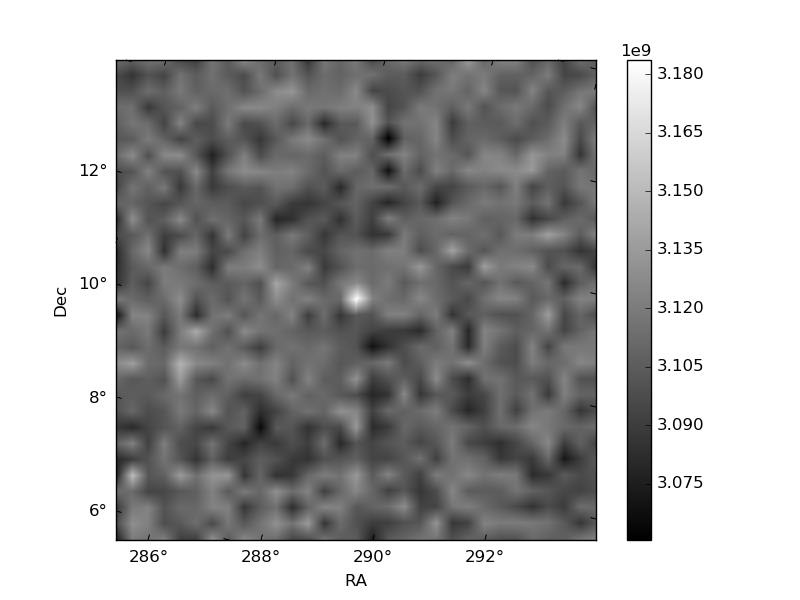
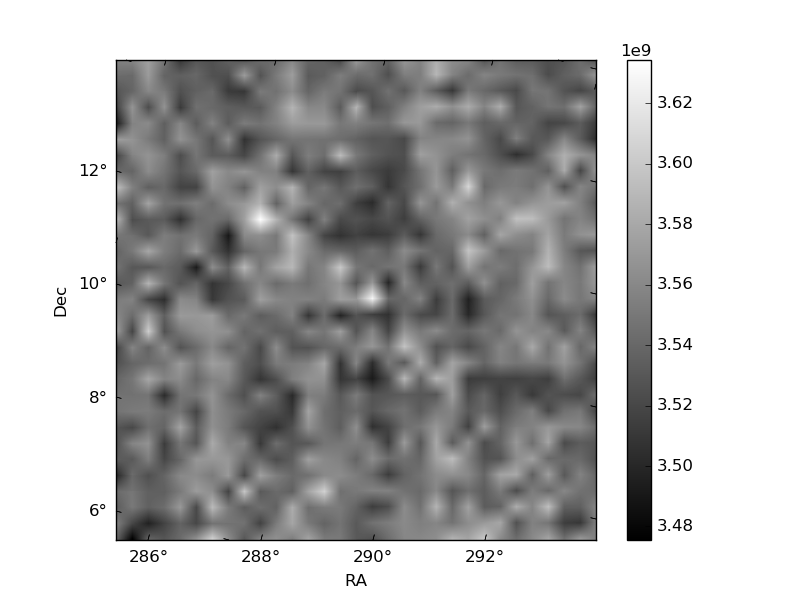
Histogram calculated using DETX and DETY for each event in the final _common_clean file
| Quadrant A |  |
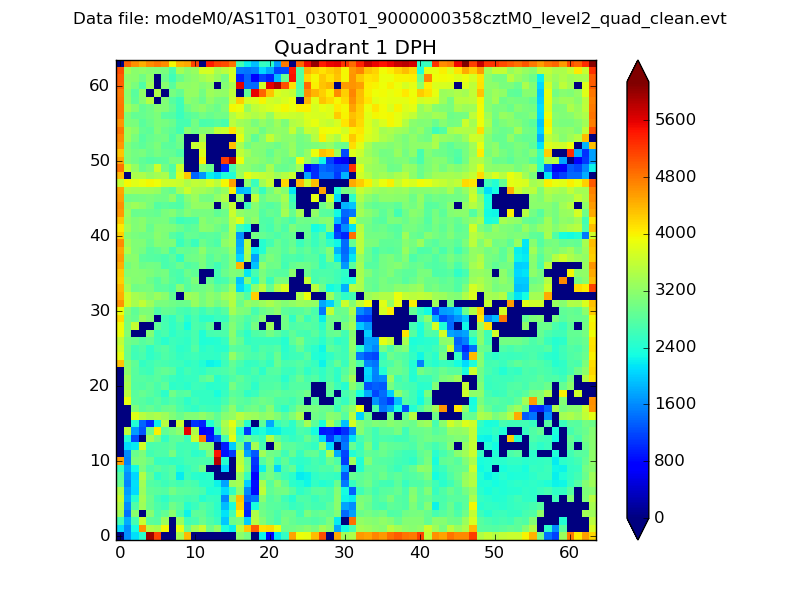 |
Quadrant B |
|---|---|---|---|
| Quadrant D |  |
 |
Quadrant C |
| Plot type | Count rate plots | Images |
|---|---|---|
| Comparison with Poisson distribution Blue bars denote a histogram of data divided into 1 sec bins. Red curve is a Poisson curve with rate = median count rate of data. |
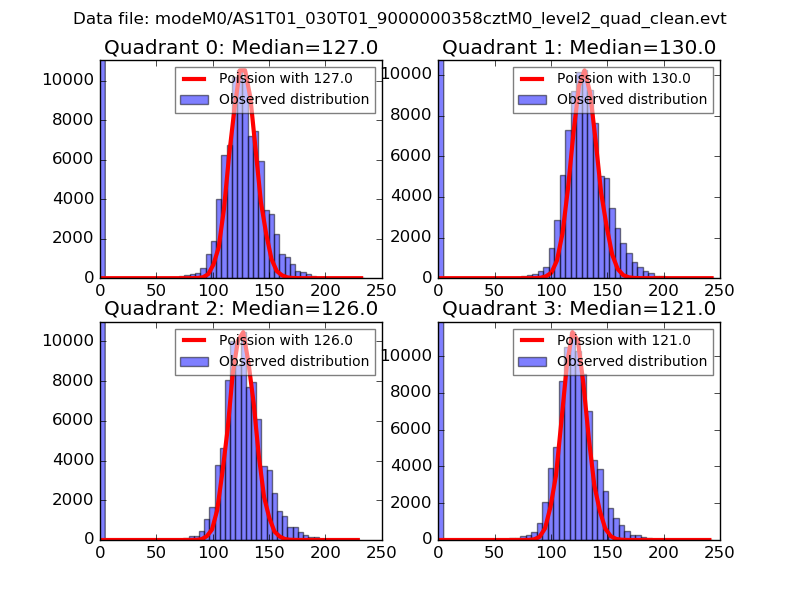 |
 |
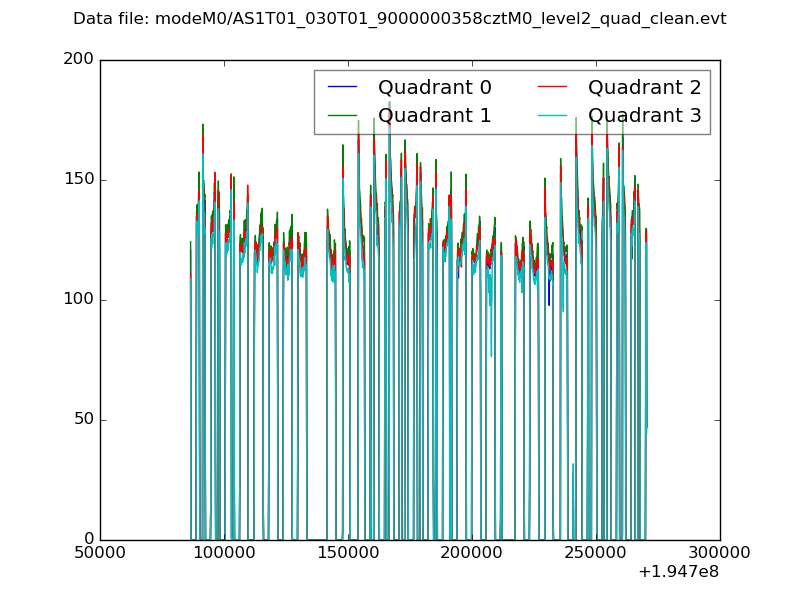
| Quadrant-wise count rates Data is divided into 100 sec bins |
 |
|
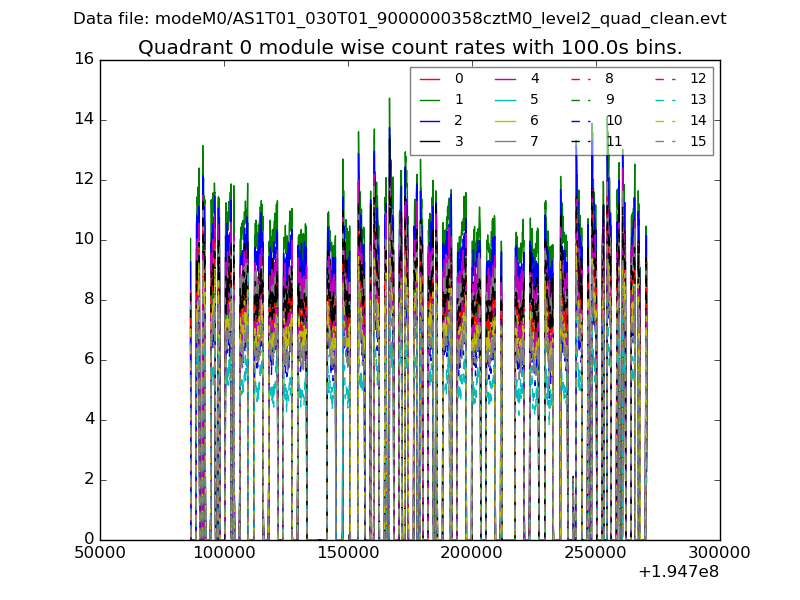
| Module-wise count rates for Quadrant A Data is divided into 100 sec bins |
 |
 |
| Module-wise count rates for Quadrant B Data is divided into 100 sec bins |
 |
 |
| Module-wise count rates for Quadrant C Data is divided into 100 sec bins |
 |
 |
| Module-wise count rates for Quadrant D Data is divided into 100 sec bins |
 |
 |
| Parameter | Plot |
|---|---|
| CZT HV Monitor |  |
| D_VDD | 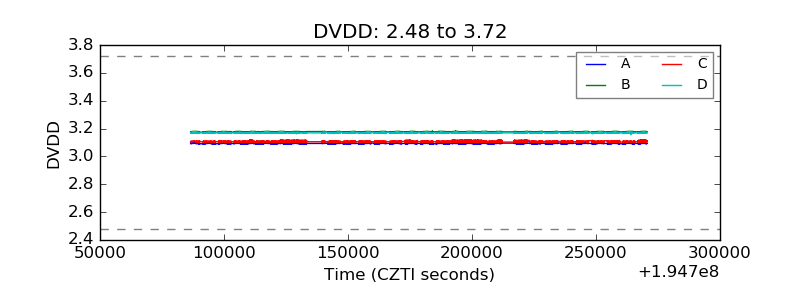 |
| Temperature 1 |  |
| Veto HV Monitor |  |
| Veto LLD |  |
| Alpha Counter | 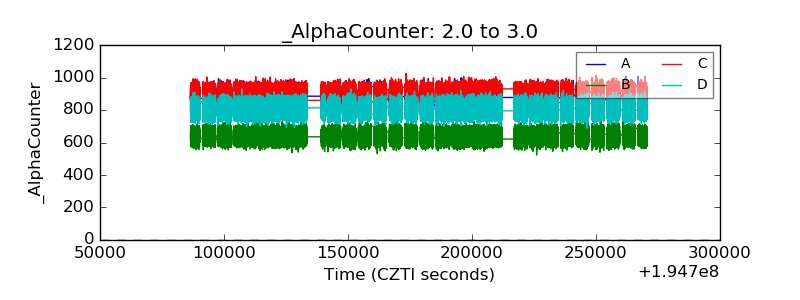 |
| _CPM_Rate | 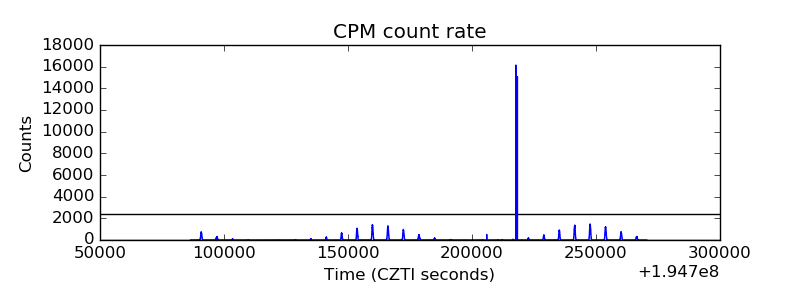 |
| CZT Counter |  |
| +2.5 Volts monitor |  |
| +5 Volts monitor | 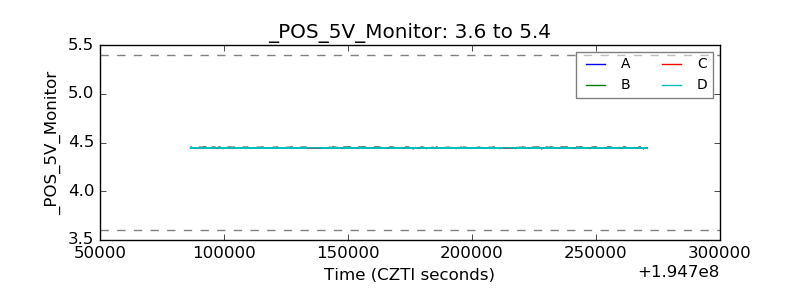 |
| _ROLL_ROT |  |
| _Roll_DEC |  |
| _Roll_RA |  |
| Veto Counter |  |