| Param | Original file | Final file |
|---|---|---|
| Filename | modeM0/AS1T01_056T01_9000000356cztM0_level2.evt | modeM0/AS1T01_056T01_9000000356cztM0_level2_quad_clean.evt |
| Size (bytes) | 10,302,845,760 | 1,612,825,920 |
| Size | 9.6 GB | 1.5 GB |
| Events in quadrant A | 64,322,743 | 9,994,564 |
| Events in quadrant B | 95,854,983 | 9,949,149 |
| Events in quadrant C | 76,941,343 | 9,921,040 |
| Events in quadrant D | 65,702,832 | 9,627,282 |
| Mode SS | |||
|---|---|---|---|
| Quadrant | BADHDUFLAG | Total packets | Discarded packets |
| A | 0 | 2774 | 0 |
| B | 0 | 2774 | 0 |
| C | 0 | 2774 | 0 |
| D | 0 | 2774 | 0 |
| Mode M9 | |||
|---|---|---|---|
| Quadrant | BADHDUFLAG | Total packets | Discarded packets |
| A | 0 | 186 | 0 |
| B | 0 | 186 | 0 |
| C | 0 | 186 | 0 |
| D | 0 | 186 | 0 |
| Mode M0 | |||
|---|---|---|---|
| Quadrant | BADHDUFLAG | Total packets | Discarded packets |
| A | 0 | 284835 | 0 |
| B | 0 | 377531 | 0 |
| C | 0 | 320218 | 0 |
| D | 0 | 294076 | 0 |
| Quadrant | Total seconds | Saturated seconds | Saturation percentage |
|---|---|---|---|
| A | 136596 | 1990 | 1.456851% |
| B | 136596 | 5890 | 4.311986% |
| C | 136596 | 3333 | 2.440042% |
| D | 136596 | 1661 | 1.215995% |
Noise dominated data is calculated using 1-second bins in cleaned event files. If a bin has >2000 counts, and if more than 50% of those come from <1% of pixels, then it is considered to be noise-dominated and hence unusable.
| Quadrant | # 1 sec bins | Bins with >0 counts | Bins with >2000 counts | High rate bins dominated by noise | Noise dominated (total time) | Noise dominated (detector-on time) | Marked lightcurve |
|---|---|---|---|---|---|---|---|
| A | 155172 | 136615 | 217 | 217 | 0.14% | 0.16% |  |
| B | 155172 | 136616 | 1988 | 1988 | 1.28% | 1.46% |  |
| C | 155171 | 136615 | 1784 | 1784 | 1.15% | 1.31% | 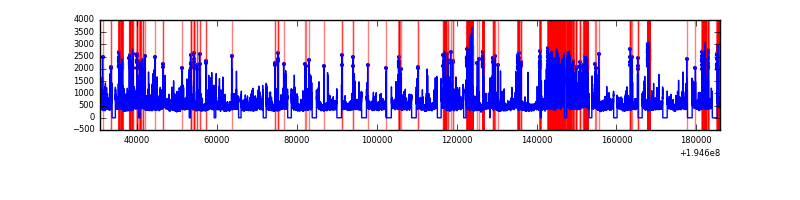 |
| D | 155172 | 136617 | 445 | 445 | 0.29% | 0.33% |  |
Top three noisy pixels from each quadrant. If the there are fewer than three noisy pixels in the level2.evt file, extra rows are filled as -1
| Pixel properties | Quadrant properties | ||||||
|---|---|---|---|---|---|---|---|
| Quadrant | DetID | PixID | Counts | Sigma | Mean | Median | Sigma |
| A | 0 | 149 | 1168359 | 354.08 | 16164 | 15817 | 3255.0 |
| A | 8 | 192 | 418975 | 123.86 | 16164 | 15817 | 3255.0 |
| A | 0 | 226 | 290971 | 84.53 | 16164 | 15817 | 3255.0 |
| B | 0 | 85 | 24365721 | 7969.73 | 16217 | 15812 | 3055.3 |
| B | 4 | 48 | 5316673 | 1734.97 | 16217 | 15812 | 3055.3 |
| B | 14 | 167 | 1363721 | 441.17 | 16217 | 15812 | 3055.3 |
| C | 5 | 234 | 10833708 | 2985.74 | 15641 | 15713 | 3623.2 |
| C | 14 | 223 | 1568800 | 428.65 | 15641 | 15713 | 3623.2 |
| C | 7 | 220 | 1300786 | 354.68 | 15641 | 15713 | 3623.2 |
| D | 8 | 195 | 2544931 | 686.53 | 15617 | 15278 | 3684.7 |
| D | 6 | 112 | 542411 | 143.06 | 15617 | 15278 | 3684.7 |
| D | 14 | 34 | 539955 | 142.39 | 15617 | 15278 | 3684.7 |
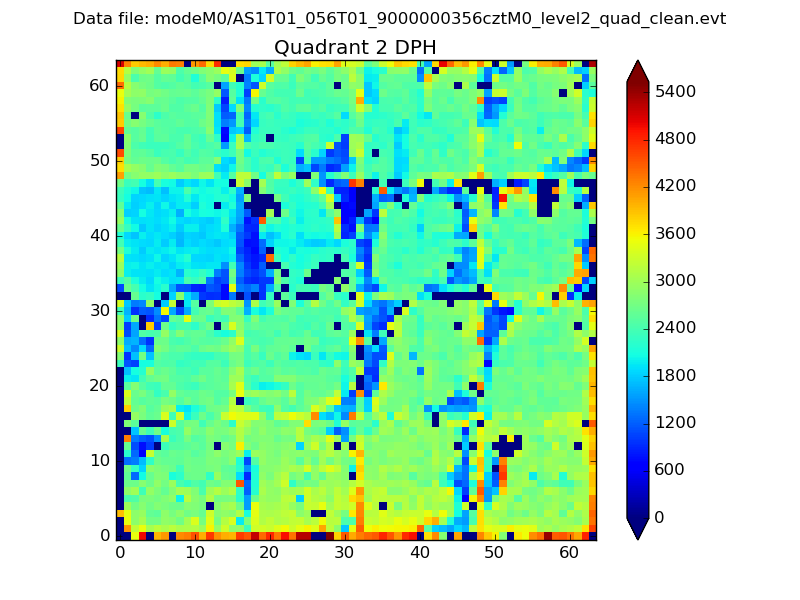
Histogram calculated using DETX and DETY for each event in the final _common_clean file
| Quadrant A |  |
 |
Quadrant B |
|---|---|---|---|
| Quadrant D | 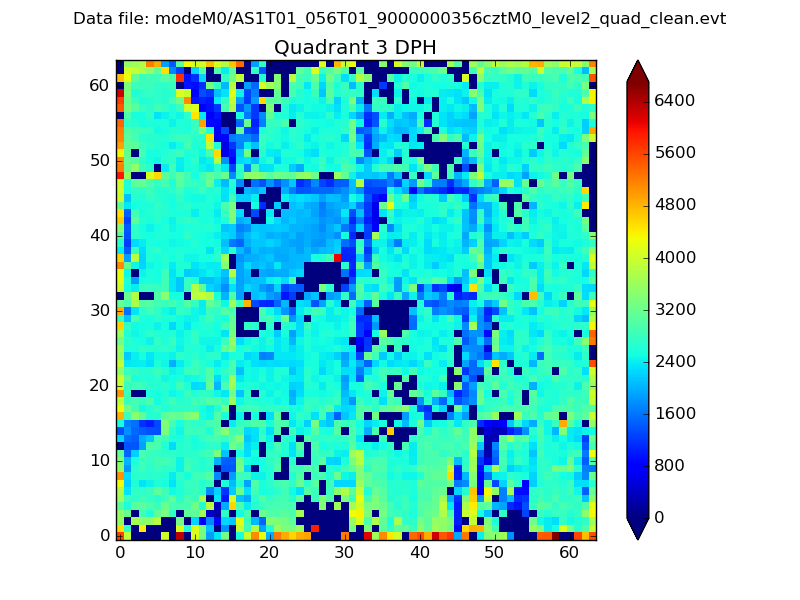 |
 |
Quadrant C |
| Plot type | Count rate plots | Images |
|---|---|---|
| Comparison with Poisson distribution Blue bars denote a histogram of data divided into 1 sec bins. Red curve is a Poisson curve with rate = median count rate of data. |
 |
 |
| Quadrant-wise count rates Data is divided into 100 sec bins |
 |
|
| Module-wise count rates for Quadrant A Data is divided into 100 sec bins |
 |
 |
| Module-wise count rates for Quadrant B Data is divided into 100 sec bins |
 |
 |
| Module-wise count rates for Quadrant C Data is divided into 100 sec bins |
 |
 |
| Module-wise count rates for Quadrant D Data is divided into 100 sec bins |
 |
 |
| Parameter | Plot |
|---|---|
| CZT HV Monitor | 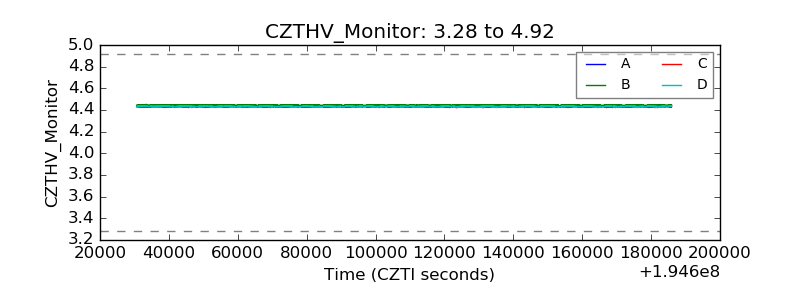 |
| D_VDD |  |
| Temperature 1 | 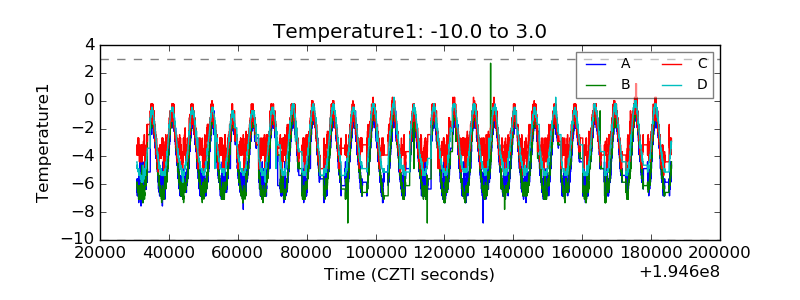 |
| Veto HV Monitor |  |
| Veto LLD |  |
| Alpha Counter |  |
| _CPM_Rate | 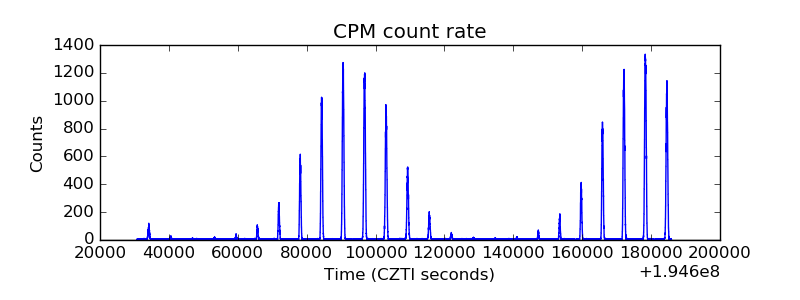 |
| CZT Counter | 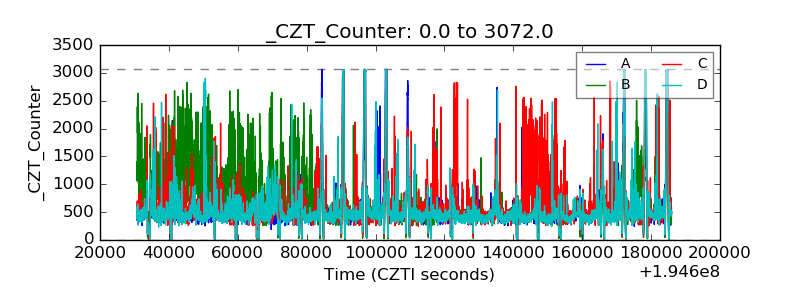 |
| +2.5 Volts monitor |  |
| +5 Volts monitor |  |
| _ROLL_ROT | 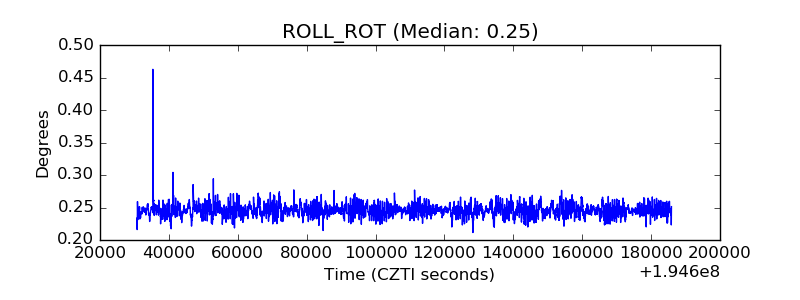 |
| _Roll_DEC |  |
| _Roll_RA |  |
| Veto Counter |  |