| Param | Original file | Final file |
|---|---|---|
| Filename | modeM0/AS1T01_040T01_9000000354cztM0_level2.evt | modeM0/AS1T01_040T01_9000000354cztM0_level2_quad_clean.evt |
| Size (bytes) | 1,973,468,160 | 306,190,080 |
| Size | 1.8 GB | 292.0 MB |
| Events in quadrant A | 10,179,631 | 1,988,672 |
| Events in quadrant B | 23,566,367 | 1,935,059 |
| Events in quadrant C | 14,245,189 | 1,929,134 |
| Events in quadrant D | 10,292,601 | 1,905,133 |
| Mode SS | |||
|---|---|---|---|
| Quadrant | BADHDUFLAG | Total packets | Discarded packets |
| A | 0 | 450 | 0 |
| B | 0 | 450 | 0 |
| C | 0 | 450 | 0 |
| D | 0 | 450 | 0 |
| Mode M9 | |||
|---|---|---|---|
| Quadrant | BADHDUFLAG | Total packets | Discarded packets |
| A | 0 | 60 | 0 |
| B | 0 | 60 | 0 |
| C | 0 | 60 | 0 |
| D | 0 | 60 | 0 |
| Mode M0 | |||
|---|---|---|---|
| Quadrant | BADHDUFLAG | Total packets | Discarded packets |
| A | 0 | 45586 | 0 |
| B | 0 | 85576 | 0 |
| C | 0 | 57138 | 0 |
| D | 0 | 46612 | 0 |
| Quadrant | Total seconds | Saturated seconds | Saturation percentage |
|---|---|---|---|
| A | 22016 | 429 | 1.948583% |
| B | 22016 | 3265 | 14.830124% |
| C | 22016 | 838 | 3.806323% |
| D | 22016 | 372 | 1.689680% |
Noise dominated data is calculated using 1-second bins in cleaned event files. If a bin has >2000 counts, and if more than 50% of those come from <1% of pixels, then it is considered to be noise-dominated and hence unusable.
| Quadrant | # 1 sec bins | Bins with >0 counts | Bins with >2000 counts | High rate bins dominated by noise | Noise dominated (total time) | Noise dominated (detector-on time) | Marked lightcurve |
|---|---|---|---|---|---|---|---|
| A | 28030 | 22016 | 3 | 3 | 0.01% | 0.01% |  |
| B | 28030 | 22015 | 2382 | 2382 | 8.50% | 10.82% |  |
| C | 28030 | 22016 | 315 | 315 | 1.12% | 1.43% |  |
| D | 28030 | 22015 | 26 | 26 | 0.09% | 0.12% |  |
Top three noisy pixels from each quadrant. If the there are fewer than three noisy pixels in the level2.evt file, extra rows are filled as -1
| Pixel properties | Quadrant properties | ||||||
|---|---|---|---|---|---|---|---|
| Quadrant | DetID | PixID | Counts | Sigma | Mean | Median | Sigma |
| A | 12 | 133 | 33415 | 58.94 | 2630 | 2576 | 523.2 |
| A | 0 | 226 | 31244 | 54.79 | 2630 | 2576 | 523.2 |
| A | 0 | 149 | 30285 | 52.96 | 2630 | 2576 | 523.2 |
| B | 0 | 85 | 12805275 | 27051.53 | 2579 | 2521 | 473.3 |
| B | 4 | 48 | 676097 | 1423.23 | 2579 | 2521 | 473.3 |
| B | 8 | 3 | 77772 | 159.0 | 2579 | 2521 | 473.3 |
| C | 14 | 223 | 2306788 | 4043.58 | 2519 | 2534 | 569.9 |
| C | 5 | 234 | 2019719 | 3539.82 | 2519 | 2534 | 569.9 |
| C | 10 | 82 | 32986 | 53.44 | 2519 | 2534 | 569.9 |
| D | 8 | 195 | 383578 | 648.59 | 2524 | 2464 | 587.6 |
| D | 13 | 169 | 153153 | 256.45 | 2524 | 2464 | 587.6 |
| D | 2 | 31 | 65044 | 106.5 | 2524 | 2464 | 587.6 |
Histogram calculated using DETX and DETY for each event in the final _common_clean file
| Quadrant A |  |
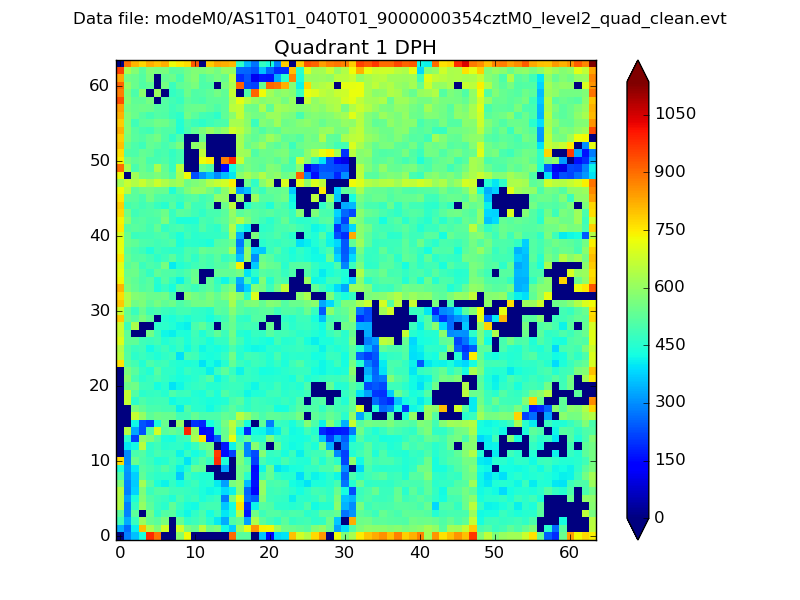 |
Quadrant B |
|---|---|---|---|
| Quadrant D |  |
 |
Quadrant C |
| Plot type | Count rate plots | Images |
|---|---|---|
| Comparison with Poisson distribution Blue bars denote a histogram of data divided into 1 sec bins. Red curve is a Poisson curve with rate = median count rate of data. |
 |
 |
| Quadrant-wise count rates Data is divided into 100 sec bins |
 |
|
| Module-wise count rates for Quadrant A Data is divided into 100 sec bins |
 |
 |
| Module-wise count rates for Quadrant B Data is divided into 100 sec bins |
 |
 |
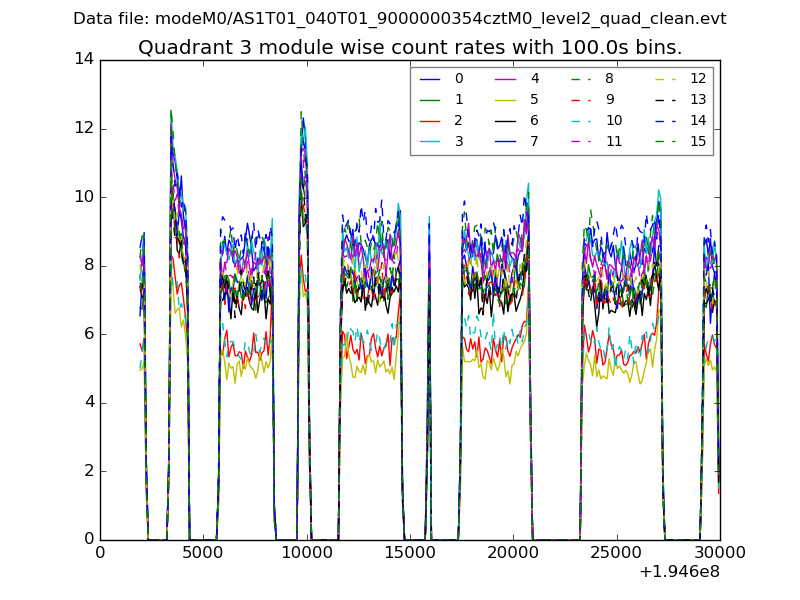
| Module-wise count rates for Quadrant C Data is divided into 100 sec bins |
 |
 |
| Module-wise count rates for Quadrant D Data is divided into 100 sec bins |
 |
 |
| Parameter | Plot |
|---|---|
| CZT HV Monitor |  |
| D_VDD |  |
| Temperature 1 |  |
| Veto HV Monitor | 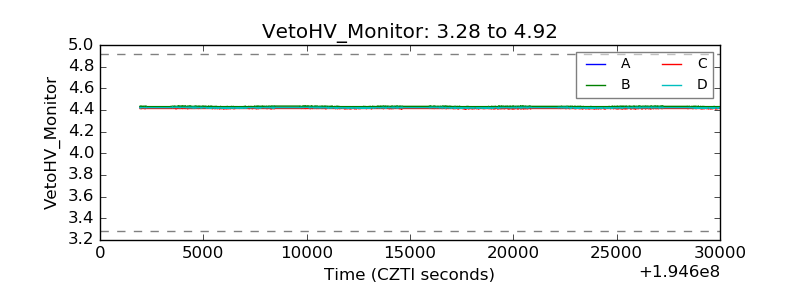 |
| Veto LLD |  |
| Alpha Counter |  |
| _CPM_Rate |  |
| CZT Counter |  |
| +2.5 Volts monitor |  |
| +5 Volts monitor | 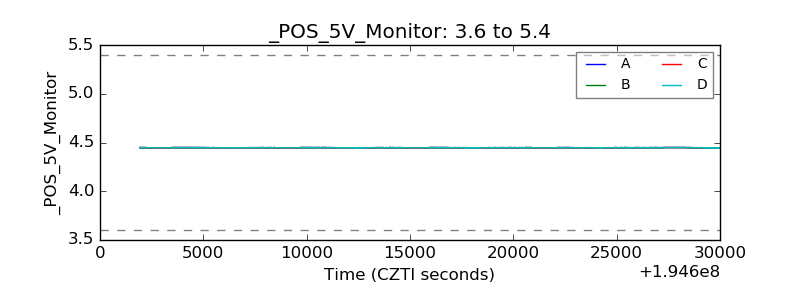 |
| _ROLL_ROT |  |
| _Roll_DEC |  |
| _Roll_RA |  |
| Veto Counter | 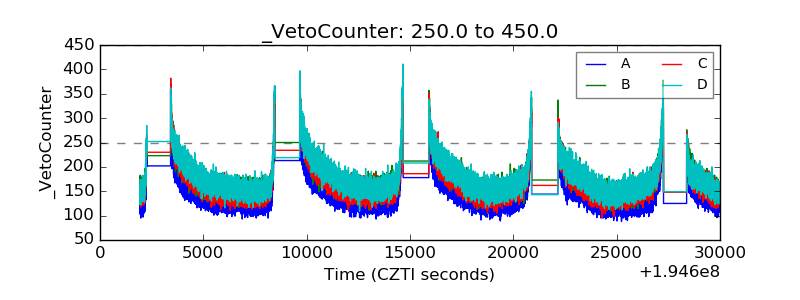 |