| Param | Original file | Final file |
|---|---|---|
| Filename | modeM0/AS1T01_043T01_9000000350cztM0_level2.evt | modeM0/AS1T01_043T01_9000000350cztM0_level2_quad_clean.evt |
| Size (bytes) | 2,328,094,080 | 342,305,280 |
| Size | 2.2 GB | 326.4 MB |
| Events in quadrant A | 13,957,313 | 2,070,315 |
| Events in quadrant B | 14,492,035 | 2,130,765 |
| Events in quadrant C | 16,639,665 | 2,084,944 |
| Events in quadrant D | 23,366,779 | 1,992,164 |
| Mode SS | |||
|---|---|---|---|
| Quadrant | BADHDUFLAG | Total packets | Discarded packets |
| A | 0 | 620 | 0 |
| B | 0 | 620 | 0 |
| C | 0 | 620 | 0 |
| D | 0 | 620 | 0 |
| Mode M0 | |||
|---|---|---|---|
| Quadrant | BADHDUFLAG | Total packets | Discarded packets |
| A | 0 | 62341 | 0 |
| B | 0 | 62925 | 0 |
| C | 0 | 69225 | 0 |
| D | 0 | 91138 | 0 |
| Mode M9 | |||
|---|---|---|---|
| Quadrant | BADHDUFLAG | Total packets | Discarded packets |
| A | 0 | 59 | 0 |
| B | 0 | 59 | 0 |
| C | 0 | 59 | 0 |
| D | 0 | 59 | 0 |
| Quadrant | Total seconds | Saturated seconds | Saturation percentage |
|---|---|---|---|
| A | 30390 | 543 | 1.786772% |
| B | 30390 | 507 | 1.668312% |
| C | 30390 | 661 | 2.175058% |
| D | 30390 | 2850 | 9.378085% |
Noise dominated data is calculated using 1-second bins in cleaned event files. If a bin has >2000 counts, and if more than 50% of those come from <1% of pixels, then it is considered to be noise-dominated and hence unusable.
| Quadrant | # 1 sec bins | Bins with >0 counts | Bins with >2000 counts | High rate bins dominated by noise | Noise dominated (total time) | Noise dominated (detector-on time) | Marked lightcurve |
|---|---|---|---|---|---|---|---|
| A | 36154 | 30390 | 0 | 0 | 0.00% | 0.00% |  |
| B | 36154 | 30390 | 6 | 6 | 0.02% | 0.02% |  |
| C | 36154 | 30390 | 126 | 126 | 0.35% | 0.41% |  |
| D | 36154 | 30390 | 2125 | 2125 | 5.88% | 6.99% |  |
Top three noisy pixels from each quadrant. If the there are fewer than three noisy pixels in the level2.evt file, extra rows are filled as -1
| Pixel properties | Quadrant properties | ||||||
|---|---|---|---|---|---|---|---|
| Quadrant | DetID | PixID | Counts | Sigma | Mean | Median | Sigma |
| A | 12 | 194 | 41452 | 51.71 | 3618 | 3541 | 733.1 |
| A | 0 | 226 | 40617 | 50.57 | 3618 | 3541 | 733.1 |
| A | 3 | 1 | 14937 | 15.54 | 3618 | 3541 | 733.1 |
| B | 8 | 3 | 195388 | 279.27 | 3660 | 3576 | 686.8 |
| B | 15 | 85 | 60030 | 82.2 | 3660 | 3576 | 686.8 |
| B | 12 | 111 | 48804 | 65.85 | 3660 | 3576 | 686.8 |
| C | 5 | 234 | 2267889 | 2774.67 | 3519 | 3535 | 816.1 |
| C | 9 | 247 | 329926 | 399.95 | 3519 | 3535 | 816.1 |
| C | 10 | 82 | 115948 | 137.75 | 3519 | 3535 | 816.1 |
| D | 9 | 66 | 9234586 | 11677.52 | 3377 | 3299 | 790.5 |
| D | 2 | 54 | 656853 | 826.74 | 3377 | 3299 | 790.5 |
| D | 10 | 102 | 248810 | 310.57 | 3377 | 3299 | 790.5 |
Histogram calculated using DETX and DETY for each event in the final _common_clean file
| Quadrant A |  |
 |
Quadrant B |
|---|---|---|---|
| Quadrant D |  |
 |
Quadrant C |
| Plot type | Count rate plots | Images |
|---|---|---|
| Comparison with Poisson distribution Blue bars denote a histogram of data divided into 1 sec bins. Red curve is a Poisson curve with rate = median count rate of data. |
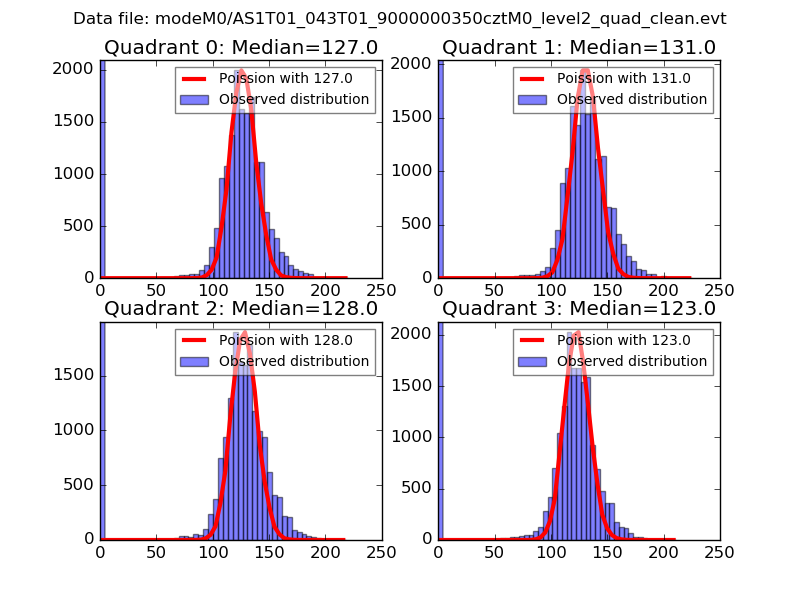 |
 |
| Quadrant-wise count rates Data is divided into 100 sec bins |
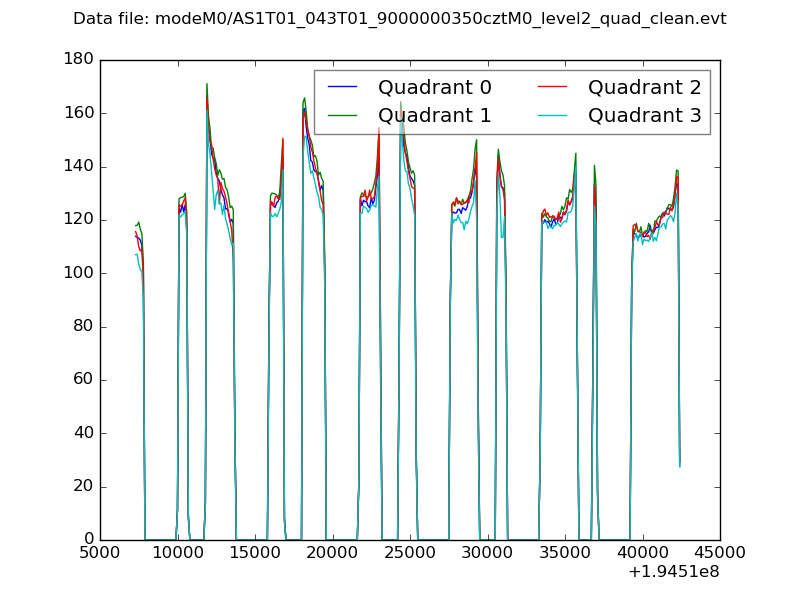 |
|
| Module-wise count rates for Quadrant A Data is divided into 100 sec bins |
 |
 |
| Module-wise count rates for Quadrant B Data is divided into 100 sec bins |
 |
 |
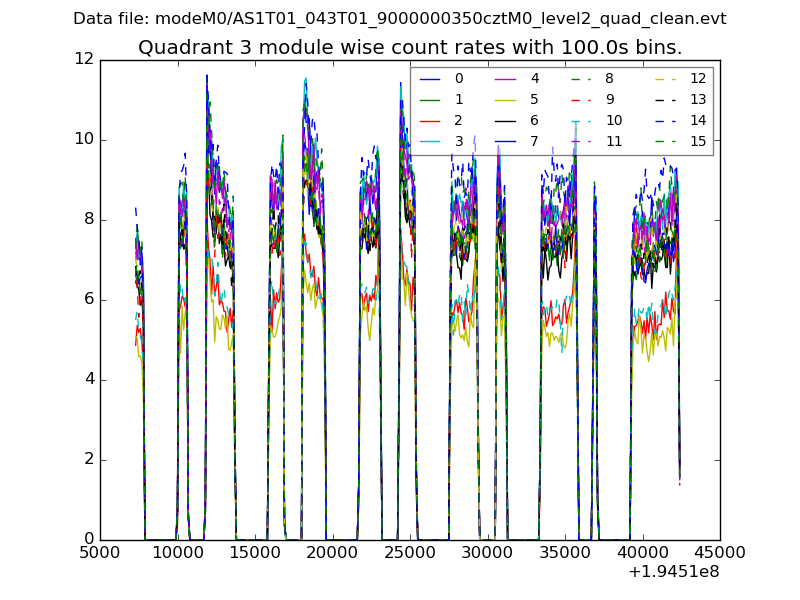
| Module-wise count rates for Quadrant C Data is divided into 100 sec bins |
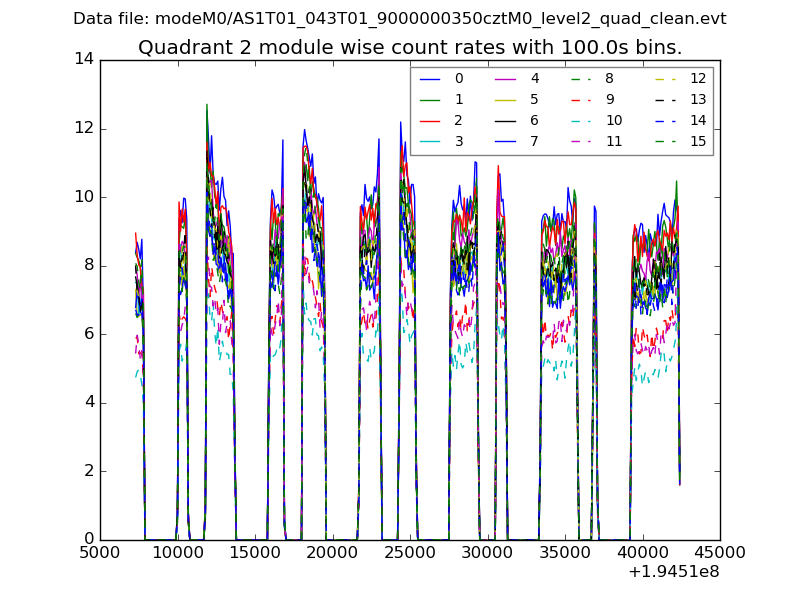 |
 |
| Module-wise count rates for Quadrant D Data is divided into 100 sec bins |
 |
 |
| Parameter | Plot |
|---|---|
| CZT HV Monitor |  |
| D_VDD |  |
| Temperature 1 | 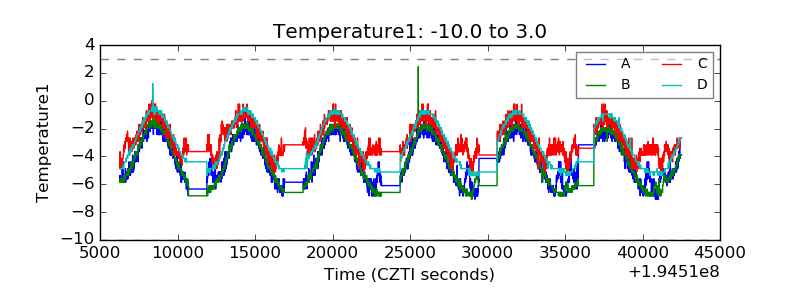 |
| Veto HV Monitor |  |
| Veto LLD |  |
| Alpha Counter |  |
| _CPM_Rate |  |
| CZT Counter |  |
| +2.5 Volts monitor |  |
| +5 Volts monitor |  |
| _ROLL_ROT |  |
| _Roll_DEC |  |
| _Roll_RA | 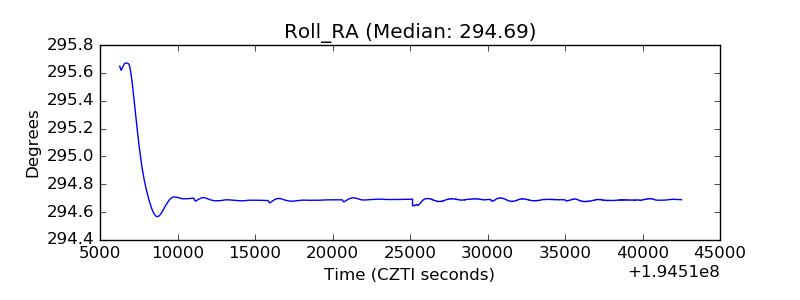 |
| Veto Counter |  |