| Param | Original file | Final file |
|---|---|---|
| Filename | modeM0/AS1T01_029T01_9000000352cztM0_level2.evt | modeM0/AS1T01_029T01_9000000352cztM0_level2_quad_clean.evt |
| Size (bytes) | 4,936,478,400 | 520,750,080 |
| Size | 4.6 GB | 496.6 MB |
| Events in quadrant A | 19,338,984 | 3,336,878 |
| Events in quadrant B | 40,083,429 | 3,266,922 |
| Events in quadrant C | 22,293,496 | 3,280,739 |
| Events in quadrant D | 64,811,653 | 2,839,412 |
| Mode M9 | |||
|---|---|---|---|
| Quadrant | BADHDUFLAG | Total packets | Discarded packets |
| A | 0 | 35 | 0 |
| B | 0 | 35 | 0 |
| C | 0 | 35 | 0 |
| D | 0 | 35 | 0 |
| Mode M0 | |||
|---|---|---|---|
| Quadrant | BADHDUFLAG | Total packets | Discarded packets |
| A | 0 | 90482 | 0 |
| B | 0 | 150744 | 0 |
| C | 0 | 96903 | 0 |
| D | 0 | 223895 | 0 |
| Mode SS | |||
|---|---|---|---|
| Quadrant | BADHDUFLAG | Total packets | Discarded packets |
| A | 0 | 898 | 0 |
| B | 0 | 898 | 0 |
| C | 0 | 898 | 0 |
| D | 0 | 898 | 0 |
| Quadrant | Total seconds | Saturated seconds | Saturation percentage |
|---|---|---|---|
| A | 44360 | 202 | 0.455365% |
| B | 44360 | 4311 | 9.718215% |
| C | 44360 | 445 | 1.003156% |
| D | 44360 | 11954 | 26.947701% |
Noise dominated data is calculated using 1-second bins in cleaned event files. If a bin has >2000 counts, and if more than 50% of those come from <1% of pixels, then it is considered to be noise-dominated and hence unusable.
| Quadrant | # 1 sec bins | Bins with >0 counts | Bins with >2000 counts | High rate bins dominated by noise | Noise dominated (total time) | Noise dominated (detector-on time) | Marked lightcurve |
|---|---|---|---|---|---|---|---|
| A | 47864 | 44363 | 5 | 5 | 0.01% | 0.01% |  |
| B | 47864 | 44362 | 2485 | 2485 | 5.19% | 5.60% |  |
| C | 47864 | 44361 | 186 | 186 | 0.39% | 0.42% | 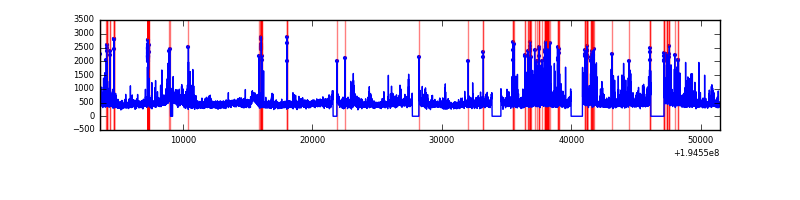 |
| D | 47865 | 44361 | 10085 | 10085 | 21.07% | 22.73% |  |
Top three noisy pixels from each quadrant. If the there are fewer than three noisy pixels in the level2.evt file, extra rows are filled as -1
| Pixel properties | Quadrant properties | ||||||
|---|---|---|---|---|---|---|---|
| Quadrant | DetID | PixID | Counts | Sigma | Mean | Median | Sigma |
| A | 0 | 149 | 182383 | 177.47 | 4953 | 4837 | 1000.5 |
| A | 0 | 226 | 73117 | 68.25 | 4953 | 4837 | 1000.5 |
| A | 12 | 194 | 56236 | 51.38 | 4953 | 4837 | 1000.5 |
| B | 0 | 85 | 20156097 | 21907.43 | 4915 | 4784 | 919.8 |
| B | 8 | 3 | 447383 | 481.17 | 4915 | 4784 | 919.8 |
| B | 4 | 48 | 283298 | 302.78 | 4915 | 4784 | 919.8 |
| C | 5 | 234 | 1405864 | 1260.74 | 4827 | 4838 | 1111.3 |
| C | 14 | 223 | 1251385 | 1121.73 | 4827 | 4838 | 1111.3 |
| C | 9 | 247 | 294232 | 260.42 | 4827 | 4838 | 1111.3 |
| D | 9 | 66 | 44796995 | 44015.34 | 4334 | 4229 | 1017.7 |
| D | 8 | 195 | 3162337 | 3103.3 | 4334 | 4229 | 1017.7 |
| D | 6 | 112 | 153261 | 146.44 | 4334 | 4229 | 1017.7 |
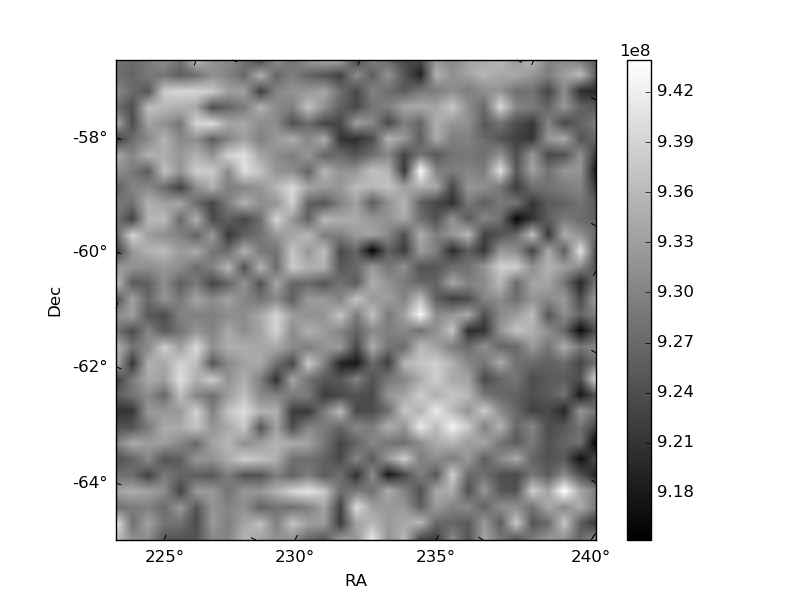
Histogram calculated using DETX and DETY for each event in the final _common_clean file
| Quadrant A |  |
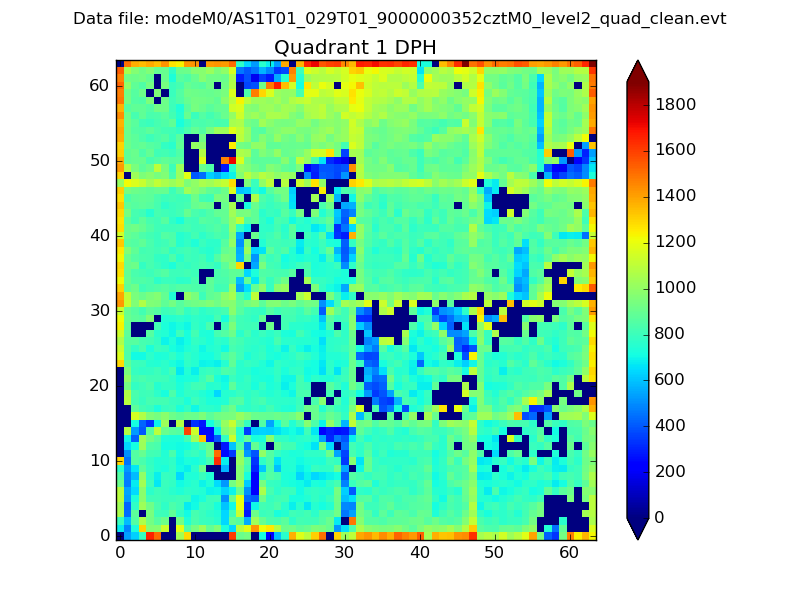 |
Quadrant B |
|---|---|---|---|
| Quadrant D |  |
 |
Quadrant C |
| Plot type | Count rate plots | Images |
|---|---|---|
| Comparison with Poisson distribution Blue bars denote a histogram of data divided into 1 sec bins. Red curve is a Poisson curve with rate = median count rate of data. |
 |
 |
| Quadrant-wise count rates Data is divided into 100 sec bins |
 |
|
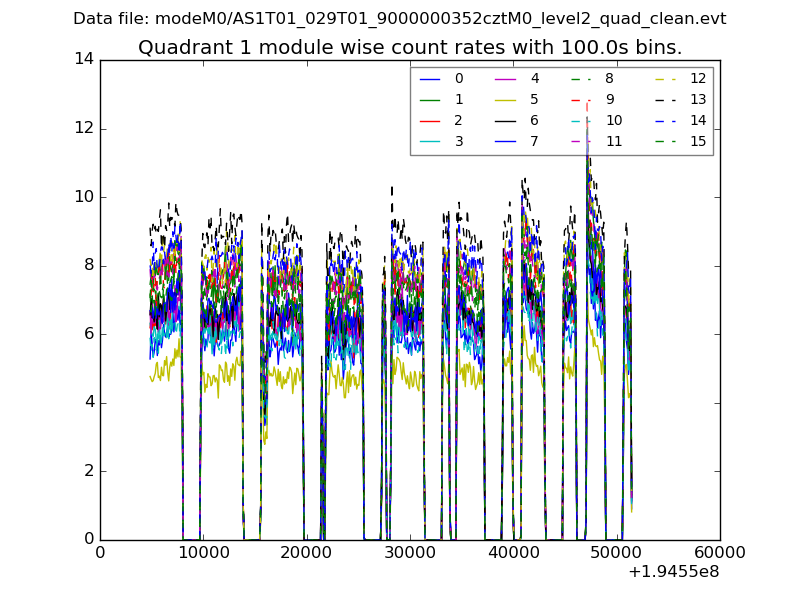
| Module-wise count rates for Quadrant A Data is divided into 100 sec bins |
 |
 |
| Module-wise count rates for Quadrant B Data is divided into 100 sec bins |
 |
 |
| Module-wise count rates for Quadrant C Data is divided into 100 sec bins |
 |
 |
| Module-wise count rates for Quadrant D Data is divided into 100 sec bins |
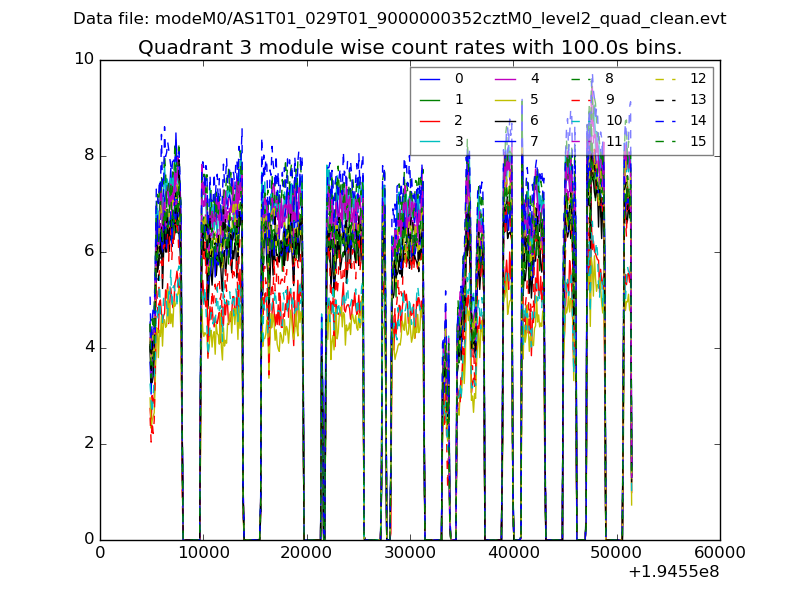 |
 |
| Parameter | Plot |
|---|---|
| CZT HV Monitor |  |
| D_VDD |  |
| Temperature 1 |  |
| Veto HV Monitor |  |
| Veto LLD | 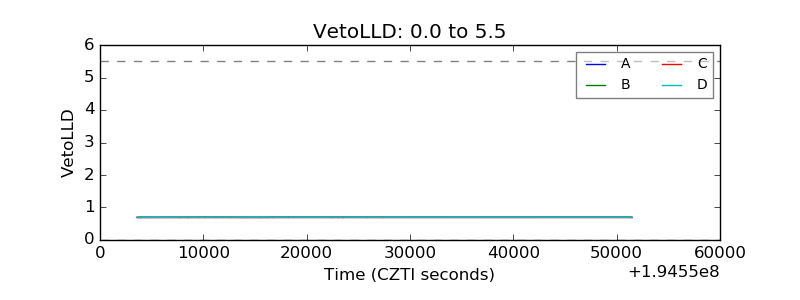 |
| Alpha Counter |  |
| _CPM_Rate |  |
| CZT Counter |  |
| +2.5 Volts monitor |  |
| +5 Volts monitor |  |
| _ROLL_ROT |  |
| _Roll_DEC |  |
| _Roll_RA |  |
| Veto Counter |  |