| Param | Original file | Final file |
|---|---|---|
| Filename | modeM0/AS1T01_058T01_9000000348cztM0_level2_bc.evt | modeM0/AS1T01_058T01_9000000348cztM0_level2_quad_clean.evt |
| Size (bytes) | 4,066,603,200 | 1,080,092,160 |
| Size | 3.8 GB | 1.0 GB |
| Events in quadrant A | 20,903,437 | 6,532,746 |
| Events in quadrant B | 23,003,608 | 6,610,329 |
| Events in quadrant C | 43,946,761 | 6,689,134 |
| Events in quadrant D | 29,143,505 | 6,674,116 |
| Mode M0 | |||
|---|---|---|---|
| Quadrant | BADHDUFLAG | Total packets | Discarded packets |
| A | 0 | 184996 | 0 |
| B | 0 | 193113 | 0 |
| C | 0 | 256707 | 0 |
| D | 0 | 210678 | 0 |
| Mode SS | |||
|---|---|---|---|
| Quadrant | BADHDUFLAG | Total packets | Discarded packets |
| A | 0 | 1824 | 0 |
| B | 0 | 1823 | 0 |
| C | 0 | 1821 | 0 |
| D | 0 | 1848 | 0 |
| Mode M9 | |||
|---|---|---|---|
| Quadrant | BADHDUFLAG | Total packets | Discarded packets |
| A | 0 | 60 | 0 |
| B | 1 | 60 | 0 |
| C | 1 | 60 | 0 |
| D | 1 | 1 | 0 |
| Quadrant | Total seconds | Saturated seconds | Saturation percentage |
|---|---|---|---|
| A | 90537 | 675 | 0.745552% |
| B | 90506 | 1619 | 1.788832% |
| C | 91344 | 8425 | 9.223375% |
| D | 89835 | 2238 | 2.491234% |
Noise dominated data is calculated using 1-second bins in cleaned event files. If a bin has >2000 counts, and if more than 50% of those come from <1% of pixels, then it is considered to be noise-dominated and hence unusable.
| Quadrant | # 1 sec bins | Bins with >0 counts | Bins with >2000 counts | High rate bins dominated by noise | Noise dominated (total time) | Noise dominated (detector-on time) | Marked lightcurve |
|---|---|---|---|---|---|---|---|
| A | 149845 | 91785 | 0 | 0 | 0.00% | 0.00% |  |
| B | 149845 | 91387 | 6 | 6 | 0.00% | 0.01% |  |
| C | 149844 | 92272 | 4313 | 4313 | 2.88% | 4.67% | 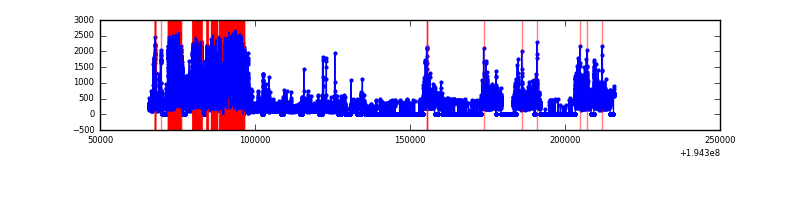 |
| D | 149845 | 90578 | 520 | 520 | 0.35% | 0.57% | 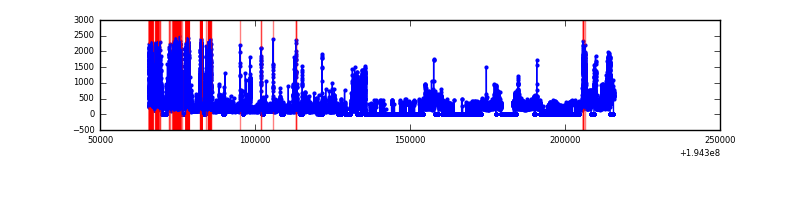 |
Top three noisy pixels from each quadrant. If the there are fewer than three noisy pixels in the level2.evt file, extra rows are filled as -1
| Pixel properties | Quadrant properties | ||||||
|---|---|---|---|---|---|---|---|
| Quadrant | DetID | PixID | Counts | Sigma | Mean | Median | Sigma |
| A | 15 | 33 | 132055 | 119.12 | 5387 | 5276 | 1064.3 |
| A | 12 | 194 | 57370 | 48.95 | 5387 | 5276 | 1064.3 |
| A | 0 | 226 | 51902 | 43.81 | 5387 | 5276 | 1064.3 |
| B | 4 | 48 | 1659302 | 1798.35 | 5426 | 5274 | 919.7 |
| B | 3 | 0 | 151144 | 158.6 | 5426 | 5274 | 919.7 |
| B | 15 | 85 | 99895 | 102.88 | 5426 | 5274 | 919.7 |
| C | 2 | 53 | 18821513 | 16845.49 | 5262 | 5225 | 1117.0 |
| C | 5 | 234 | 3560257 | 3182.68 | 5262 | 5225 | 1117.0 |
| C | 14 | 223 | 503726 | 446.29 | 5262 | 5225 | 1117.0 |
| D | 12 | 126 | 4707747 | 4093.08 | 5241 | 5104 | 1148.9 |
| D | 9 | 66 | 3825145 | 3324.88 | 5241 | 5104 | 1148.9 |
| D | 13 | 169 | 188012 | 159.2 | 5241 | 5104 | 1148.9 |
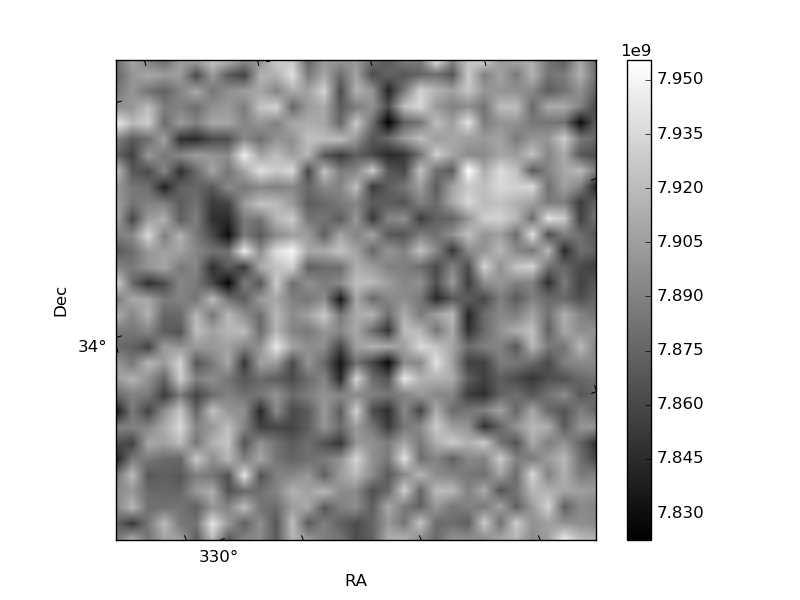
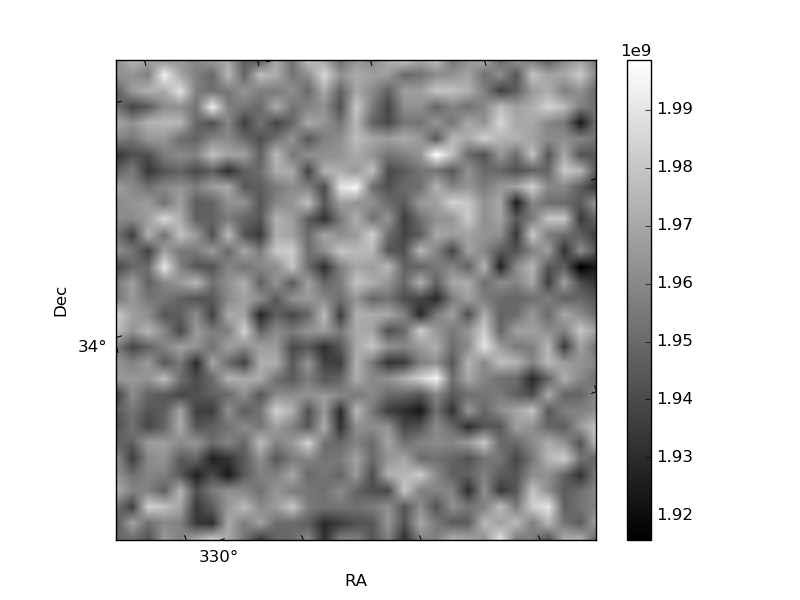
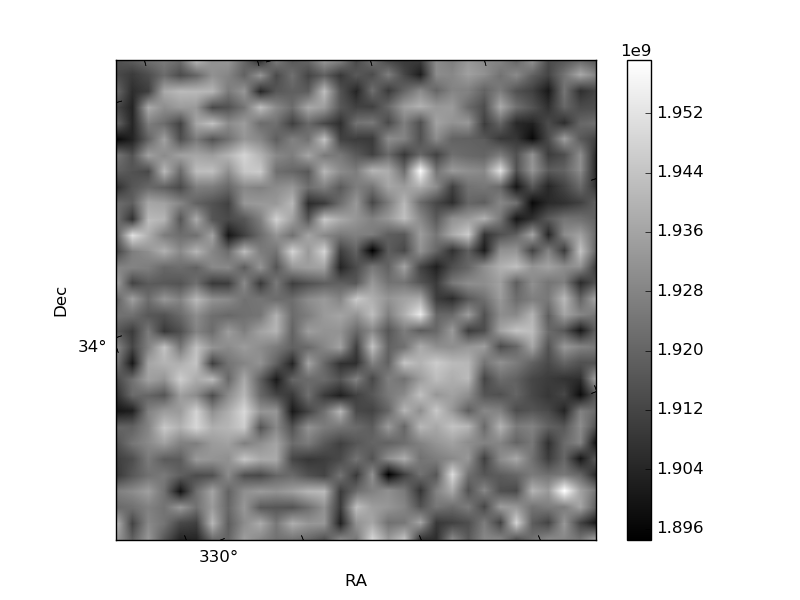
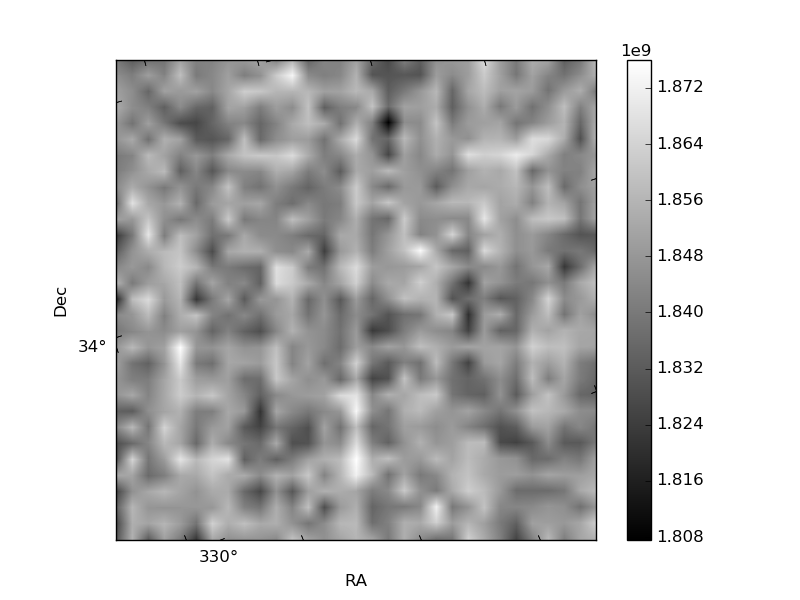
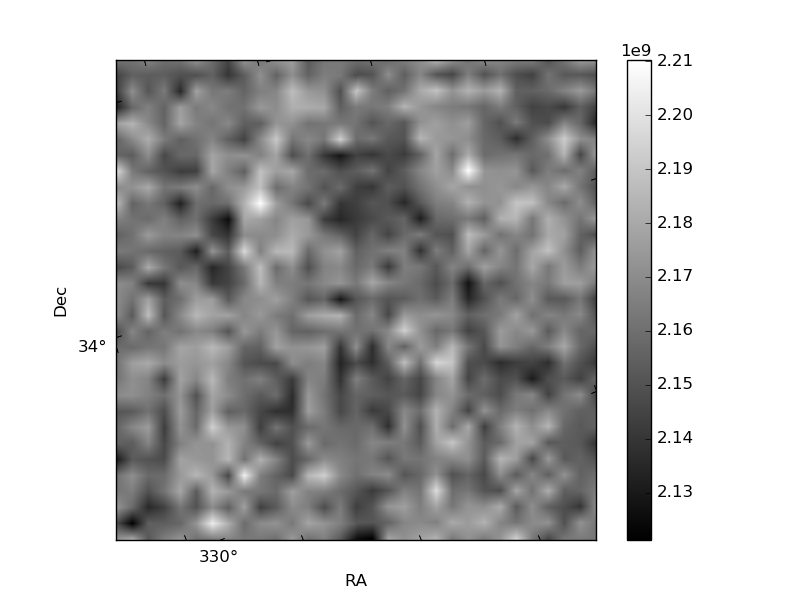
Histogram calculated using DETX and DETY for each event in the final _common_clean file
| Quadrant A |  |
 |
Quadrant B |
|---|---|---|---|
| Quadrant D |  |
 |
Quadrant C |
| Plot type | Count rate plots | Images |
|---|---|---|
| Comparison with Poisson distribution Blue bars denote a histogram of data divided into 1 sec bins. Red curve is a Poisson curve with rate = median count rate of data. |
 |
 |
| Quadrant-wise count rates Data is divided into 100 sec bins |
 |
|
| Module-wise count rates for Quadrant A Data is divided into 100 sec bins |
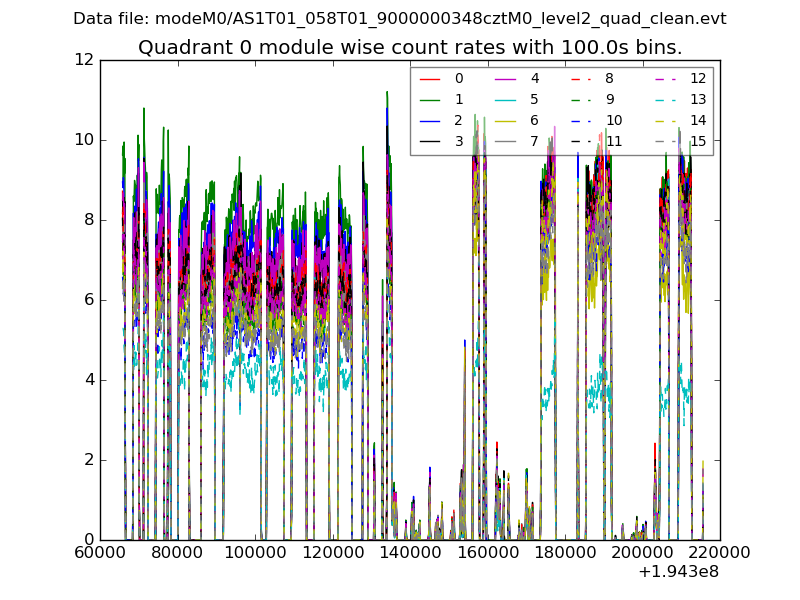 |
 |
| Module-wise count rates for Quadrant B Data is divided into 100 sec bins |
 |
 |
| Module-wise count rates for Quadrant C Data is divided into 100 sec bins |
 |
 |
| Module-wise count rates for Quadrant D Data is divided into 100 sec bins |
 |
 |
| Parameter | Plot |
|---|---|
| CZT HV Monitor |  |
| D_VDD | 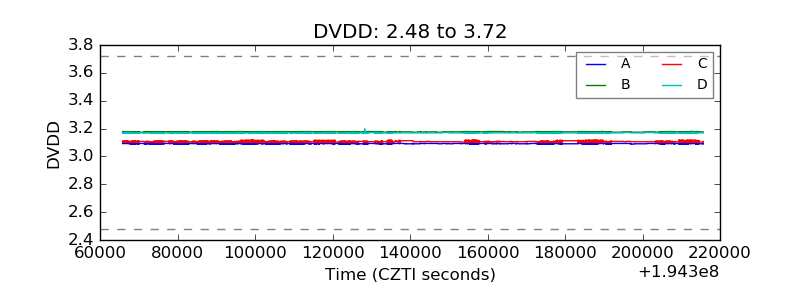 |
| Temperature 1 |  |
| Veto HV Monitor |  |
| Veto LLD | 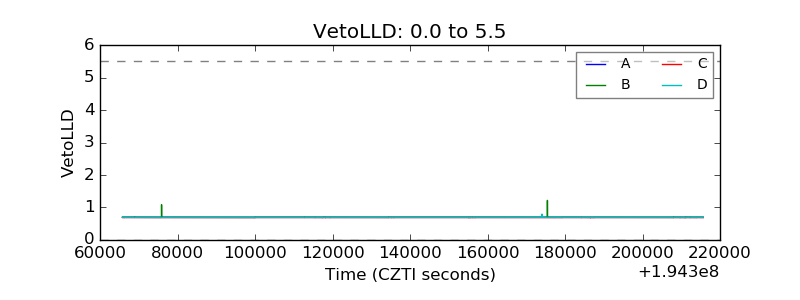 |
| Alpha Counter |  |
| _CPM_Rate |  |
| CZT Counter | 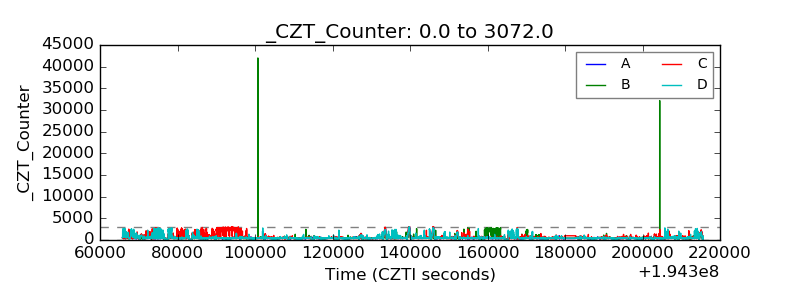 |
| +2.5 Volts monitor |  |
| +5 Volts monitor |  |
| Veto Counter | 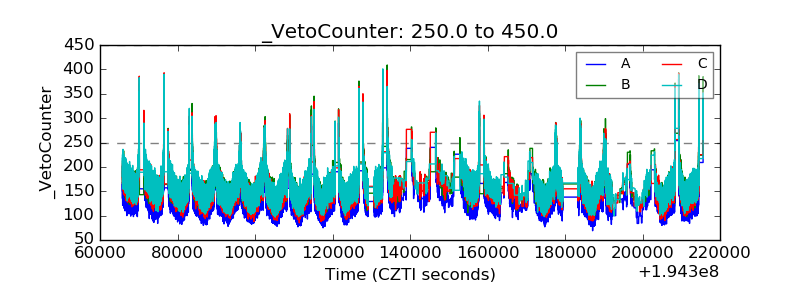 |