| Param | Original file | Final file |
|---|---|---|
| Filename | modeM0/AS1G02_018T08_9000000346cztM0_level2.evt | modeM0/AS1G02_018T08_9000000346cztM0_level2_quad_clean.evt |
| Size (bytes) | 9,235,226,880 | 1,704,168,000 |
| Size | 8.6 GB | 1.6 GB |
| Events in quadrant A | 63,498,064 | 10,492,155 |
| Events in quadrant B | 65,589,598 | 10,699,730 |
| Events in quadrant C | 65,828,875 | 10,598,634 |
| Events in quadrant D | 75,325,744 | 10,237,947 |
| Mode SS | |||
|---|---|---|---|
| Quadrant | BADHDUFLAG | Total packets | Discarded packets |
| A | 0 | 2790 | 0 |
| B | 0 | 2807 | 0 |
| C | 0 | 2808 | 0 |
| D | 0 | 2802 | 0 |
| Mode M0 | |||
|---|---|---|---|
| Quadrant | BADHDUFLAG | Total packets | Discarded packets |
| A | 0 | 288740 | 0 |
| B | 0 | 292238 | 0 |
| C | 0 | 292727 | 0 |
| D | 0 | 328756 | 0 |
| Mode M9 | |||
|---|---|---|---|
| Quadrant | BADHDUFLAG | Total packets | Discarded packets |
| A | 0 | 23 | 0 |
| B | 1 | 23 | 0 |
| C | 1 | 23 | 0 |
| D | 1 | 1 | 0 |
| Quadrant | Total seconds | Saturated seconds | Saturation percentage |
|---|---|---|---|
| A | 139978 | 1509 | 1.078027% |
| B | 139956 | 1802 | 1.287548% |
| C | 139904 | 1234 | 0.882033% |
| D | 139962 | 3867 | 2.762893% |
Noise dominated data is calculated using 1-second bins in cleaned event files. If a bin has >2000 counts, and if more than 50% of those come from <1% of pixels, then it is considered to be noise-dominated and hence unusable.
| Quadrant | # 1 sec bins | Bins with >0 counts | Bins with >2000 counts | High rate bins dominated by noise | Noise dominated (total time) | Noise dominated (detector-on time) | Marked lightcurve |
|---|---|---|---|---|---|---|---|
| A | 177879 | 140597 | 2 | 2 | 0.00% | 0.00% |  |
| B | 177879 | 140565 | 246 | 246 | 0.14% | 0.18% | 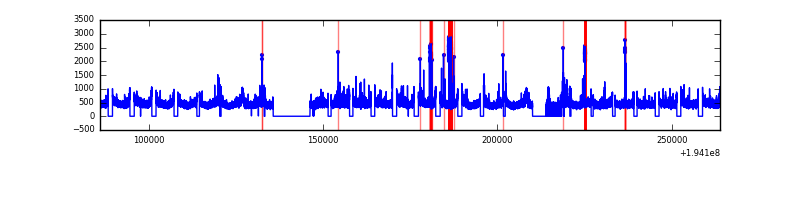 |
| C | 177879 | 140534 | 58 | 58 | 0.03% | 0.04% |  |
| D | 177879 | 140561 | 2398 | 2398 | 1.35% | 1.71% |  |
Top three noisy pixels from each quadrant. If the there are fewer than three noisy pixels in the level2.evt file, extra rows are filled as -1
| Pixel properties | Quadrant properties | ||||||
|---|---|---|---|---|---|---|---|
| Quadrant | DetID | PixID | Counts | Sigma | Mean | Median | Sigma |
| A | 3 | 1 | 307382 | 87.83 | 16334 | 15980 | 3317.9 |
| A | 0 | 8 | 185656 | 51.14 | 16334 | 15980 | 3317.9 |
| A | 12 | 194 | 185377 | 51.06 | 16334 | 15980 | 3317.9 |
| B | 7 | 205 | 608612 | 187.76 | 16590 | 16179 | 3155.3 |
| B | 8 | 3 | 531555 | 163.34 | 16590 | 16179 | 3155.3 |
| B | 12 | 111 | 236055 | 69.68 | 16590 | 16179 | 3155.3 |
| C | 5 | 234 | 1985576 | 530.58 | 15953 | 16008 | 3712.1 |
| C | 2 | 53 | 668612 | 175.8 | 15953 | 16008 | 3712.1 |
| C | 0 | 64 | 154958 | 37.43 | 15953 | 16008 | 3712.1 |
| D | 10 | 172 | 6791233 | 1819.37 | 15707 | 15311 | 3724.3 |
| D | 9 | 66 | 3638686 | 972.9 | 15707 | 15311 | 3724.3 |
| D | 12 | 126 | 2815112 | 751.76 | 15707 | 15311 | 3724.3 |
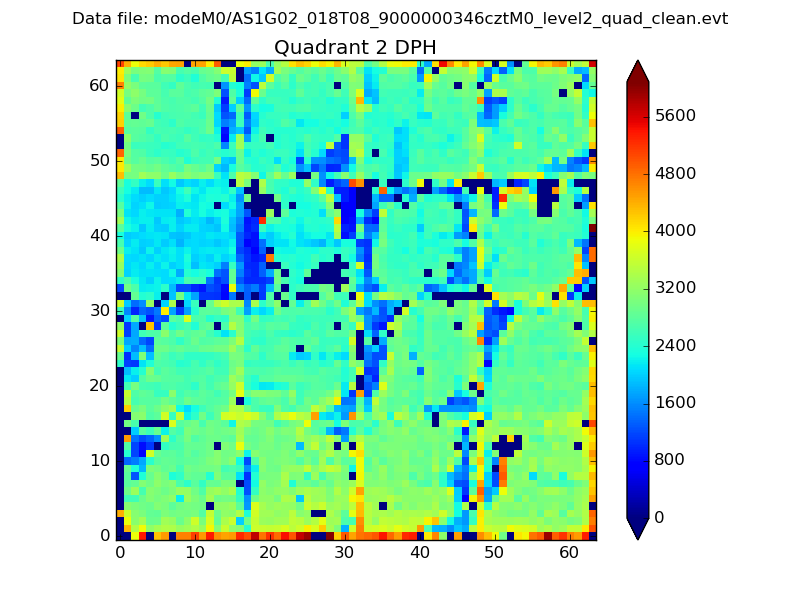
Histogram calculated using DETX and DETY for each event in the final _common_clean file
| Quadrant A |  |
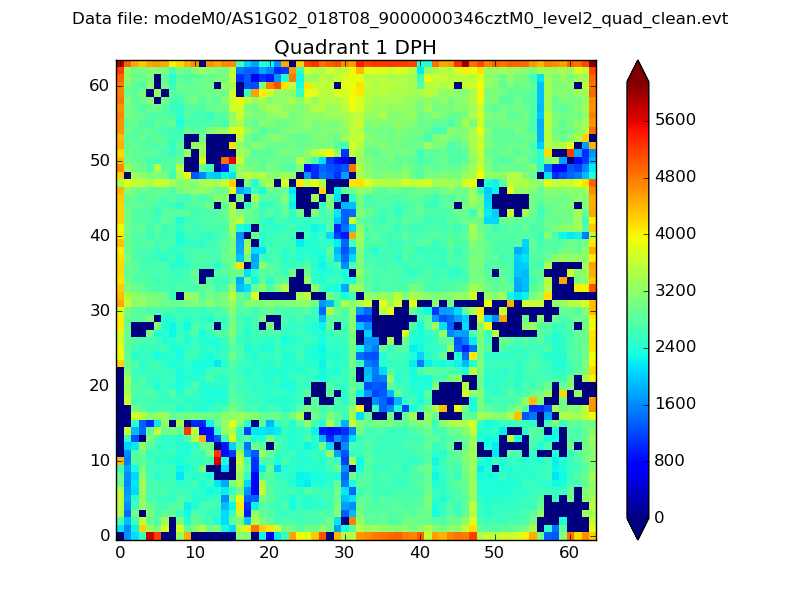 |
Quadrant B |
|---|---|---|---|
| Quadrant D |  |
 |
Quadrant C |
| Plot type | Count rate plots | Images |
|---|---|---|
| Comparison with Poisson distribution Blue bars denote a histogram of data divided into 1 sec bins. Red curve is a Poisson curve with rate = median count rate of data. |
 |
 |
| Quadrant-wise count rates Data is divided into 100 sec bins |
 |
|
| Module-wise count rates for Quadrant A Data is divided into 100 sec bins |
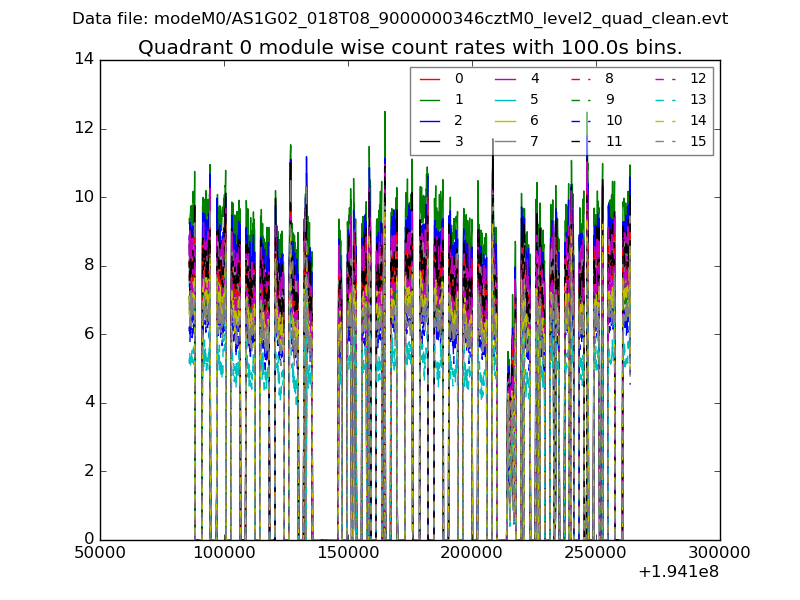 |
 |
| Module-wise count rates for Quadrant B Data is divided into 100 sec bins |
 |
 |
| Module-wise count rates for Quadrant C Data is divided into 100 sec bins |
 |
 |
| Module-wise count rates for Quadrant D Data is divided into 100 sec bins |
 |
 |
| Parameter | Plot |
|---|---|
| CZT HV Monitor |  |
| D_VDD |  |
| Temperature 1 | 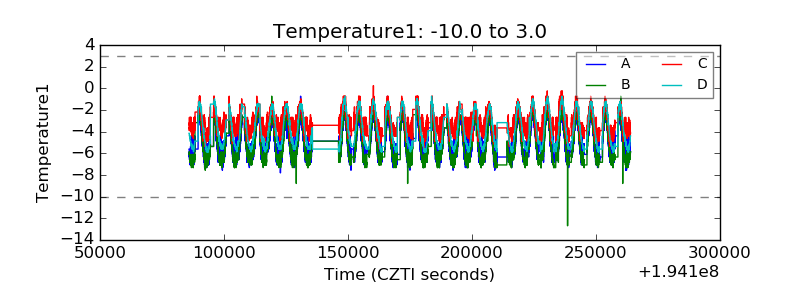 |
| Veto HV Monitor |  |
| Veto LLD |  |
| Alpha Counter | 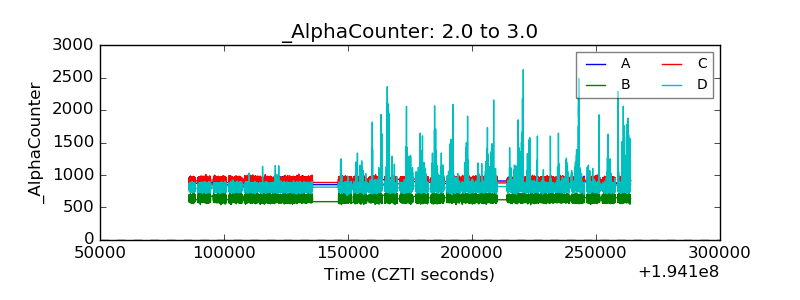 |
| _CPM_Rate |  |
| CZT Counter |  |
| +2.5 Volts monitor |  |
| +5 Volts monitor | 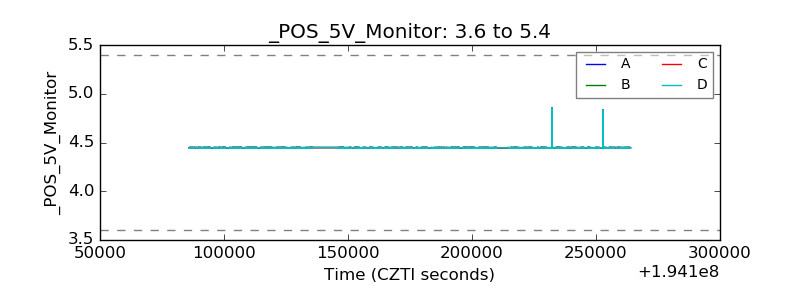 |
| _ROLL_ROT |  |
| _Roll_DEC |  |
| _Roll_RA |  |
| Veto Counter |  |